Designing CDP's first digital environmental scores delivery tool
Digitising CDP's environmental scoring tool to reduce delivery timelines by 39%.
In the video, I'll walk you through examples of UX/UI craftsmanship, collaboration with stakeholders, and how I handover designs to development teams.
In the video, I'll walk you through examples of UX/UI craftsmanship, collaboration with stakeholders, and how I handover designs to development teams.
(5 minute watch per chapter)
Overview
CDP's environmental scores influence billions in sustainability investments globally. For the first time in company history, we were transitioning from offline scoring processes to a fully digital platform.
There was no digital interface for displaying, processing, and publishing final scores — the critical end deliverable that organizations worldwide depend on for sustainability decision-making.
The stakes (were sky-high!)
Business impact: Final scores represent CDP's core value proposition to customers
Customer impact: Over 20,000 organizations will use these scores for shareholder reporting and inform strategic sustainability planning (influencing £ millions in sustainability investments)
Risks: First-time digital transformation of a mission-critical business function
Requirements: Zero tolerance for errors in score delivery

My approach
As you'll see in the video, this was a complex challenge that required more than designing screens. Here's a breakdown of the steps I took to tackle this challenge:
1. Co-designing business processes:
No pre-existing digital workflows meant we had to define a new business process altogether.
• Created comprehensive discovery documentation to align stakeholders on unknowns
• Developed structured knowledge gap analysis with 15+ critical question
• Mapped cross-functional user flows across multiple internal teams
• Co-designed new workflows with climate experts, balancing accuracy and operational efficiency
• Developed structured knowledge gap analysis with 15+ critical question
• Mapped cross-functional user flows across multiple internal teams
• Co-designed new workflows with climate experts, balancing accuracy and operational efficiency
2. Align internal stakeholders:
Essential business requirements had to be met, but we had to all agree on a process that worked across teams with varying responsibilities
• Created detailed swim-lane diagrams showing interactions between teams (Engineering, Data
Platforms, Operations/Delivery teams, Executive Leadership, and other internal functions)
• Developed role-based user flow maps
• Facilitated live alignment sessions using visual documentation
• Established decision-making frameworks and diagrams for facilitating collaboration
Platforms, Operations/Delivery teams, Executive Leadership, and other internal functions)
• Developed role-based user flow maps
• Facilitated live alignment sessions using visual documentation
• Established decision-making frameworks and diagrams for facilitating collaboration
3. Innovate design system under constraints:
Maintain design system consistency while stretching the capabilities of existing components to accommodate bespoke design solutions
• Explored 10+ interface patterns from anchored lists to dynamic table views
• Evaluated cost-effective enhancement options vs. building from scratch, aligning with
development teams on what tradeoffs to make
• Created comprehensive component documentation that became team standard
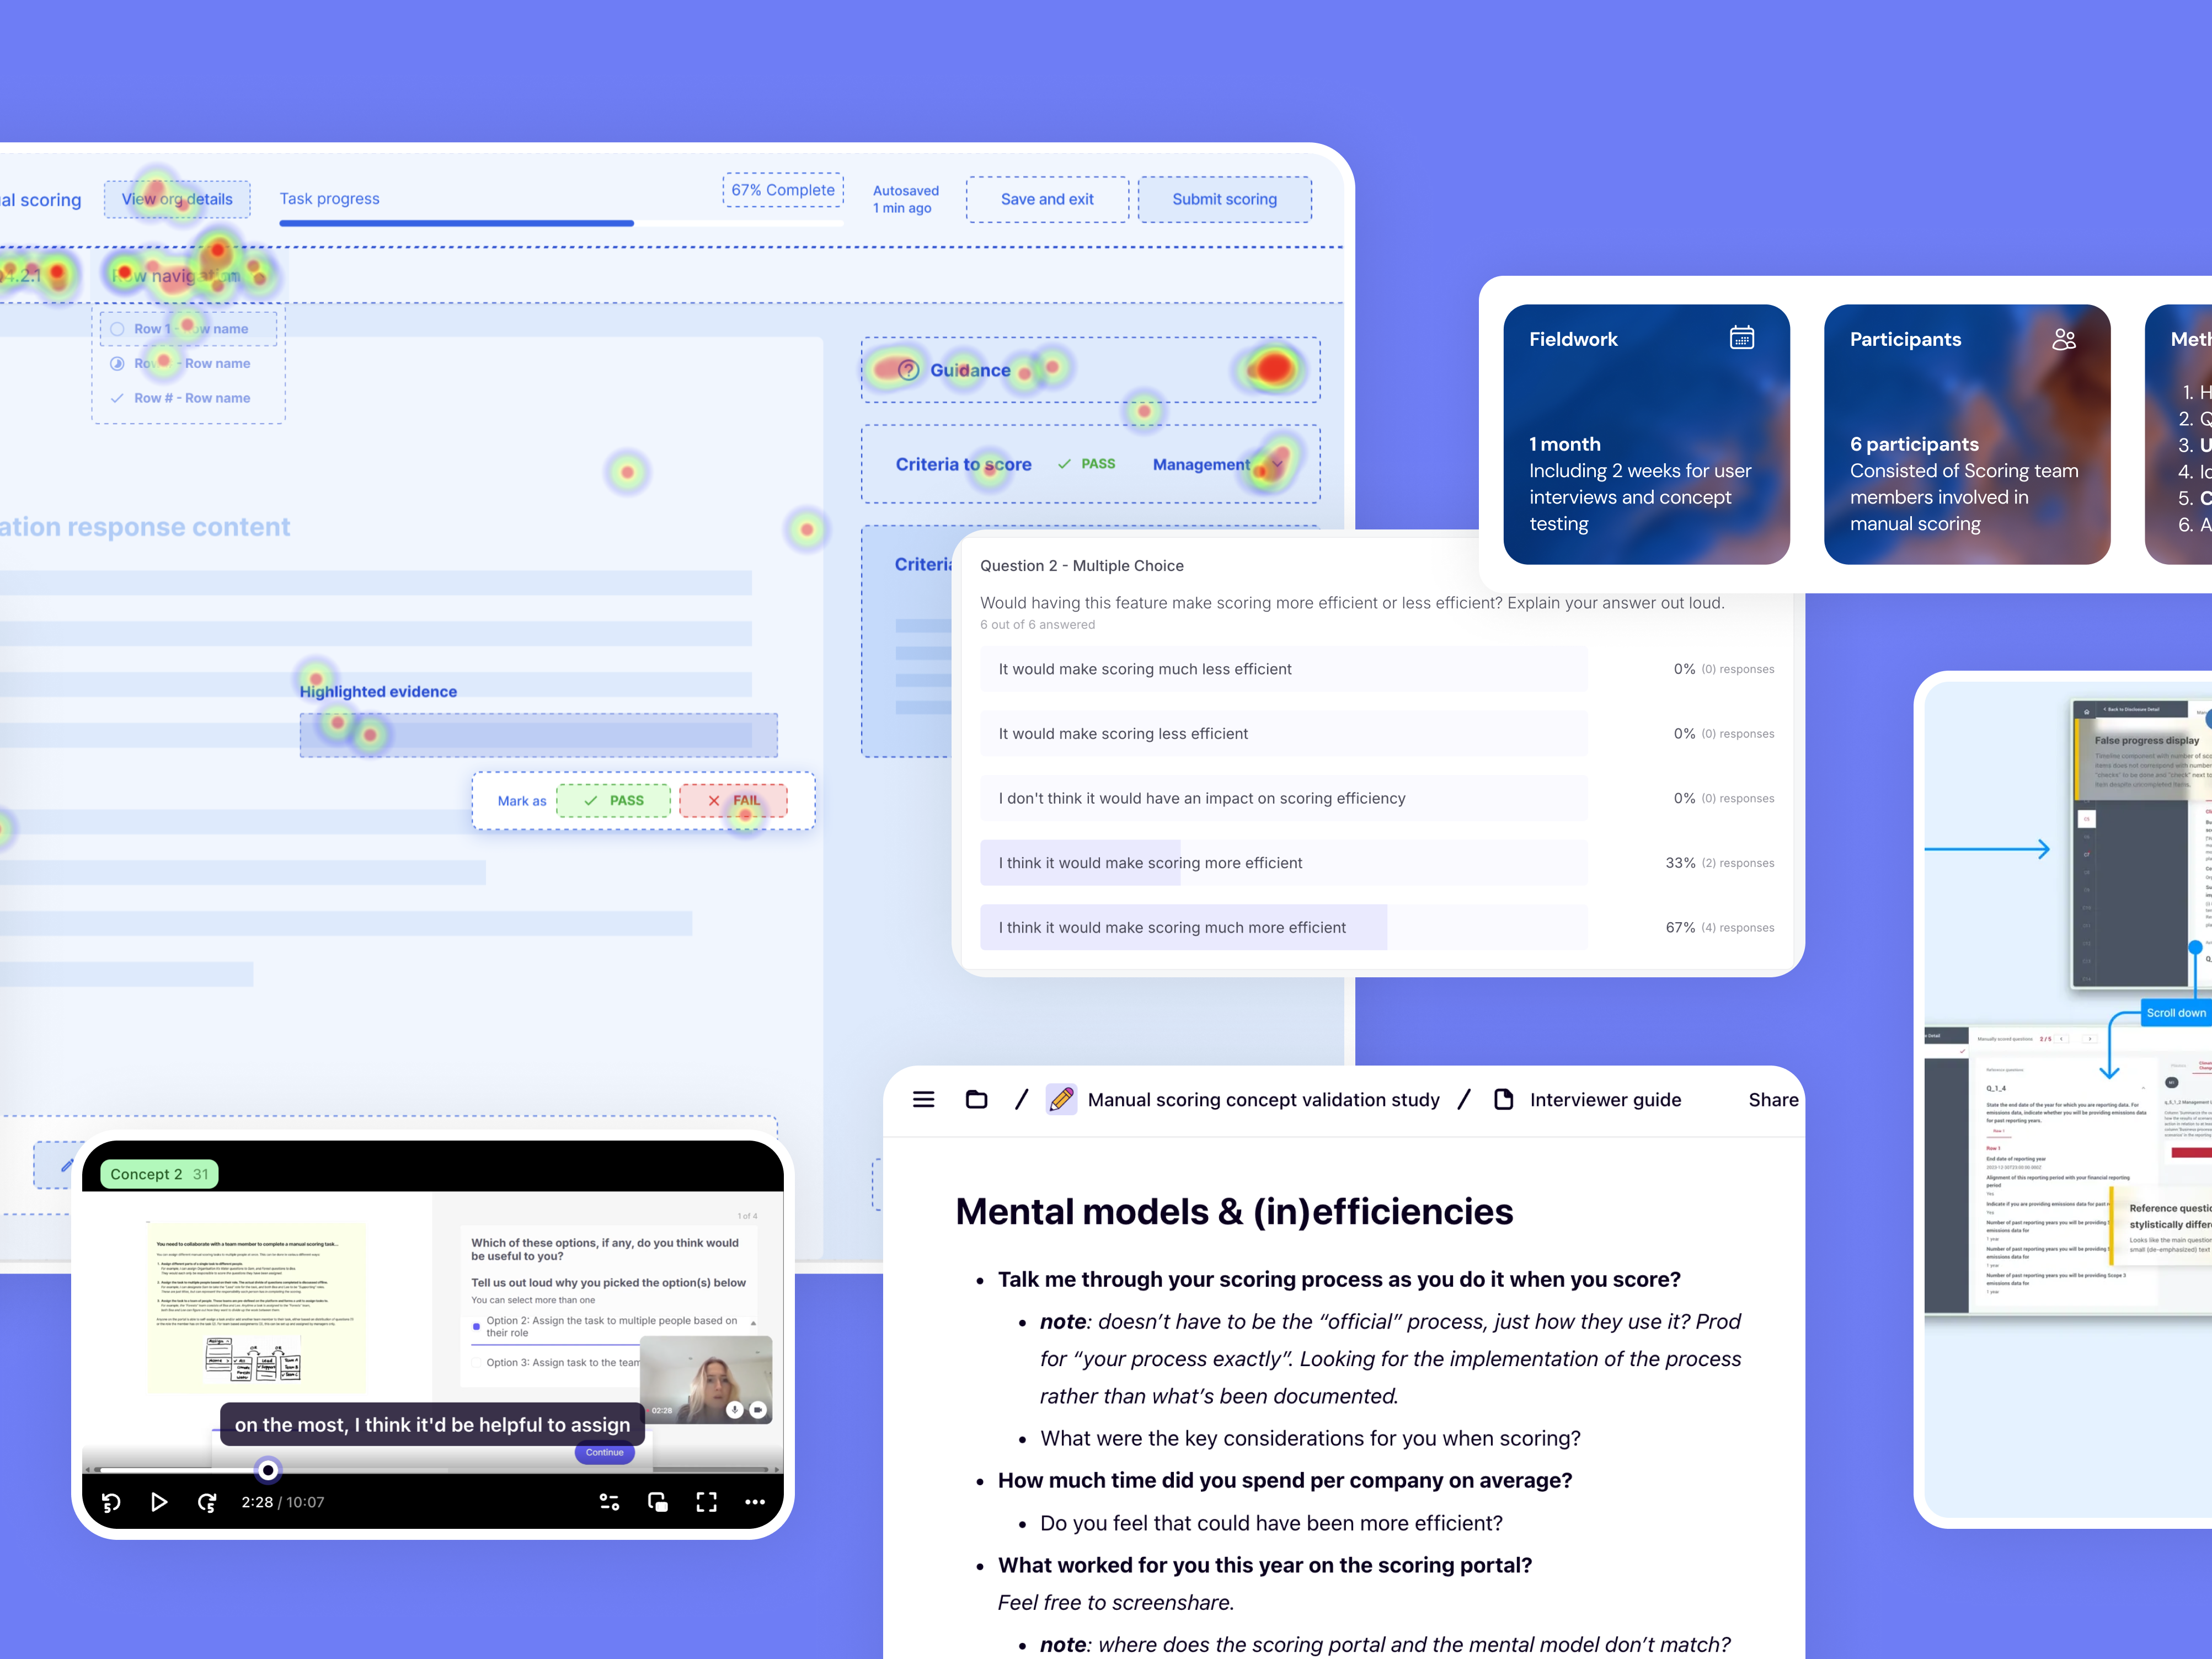
Watch my full design process along with sample documentation, artefacts, and interactive prototypes demoed in the video at the top of this page ↑
• Evaluated cost-effective enhancement options vs. building from scratch, aligning with
development teams on what tradeoffs to make
• Created comprehensive component documentation that became team standard
Watch my full design process along with sample documentation, artefacts, and interactive prototypes demoed in the video at the top of this page ↑
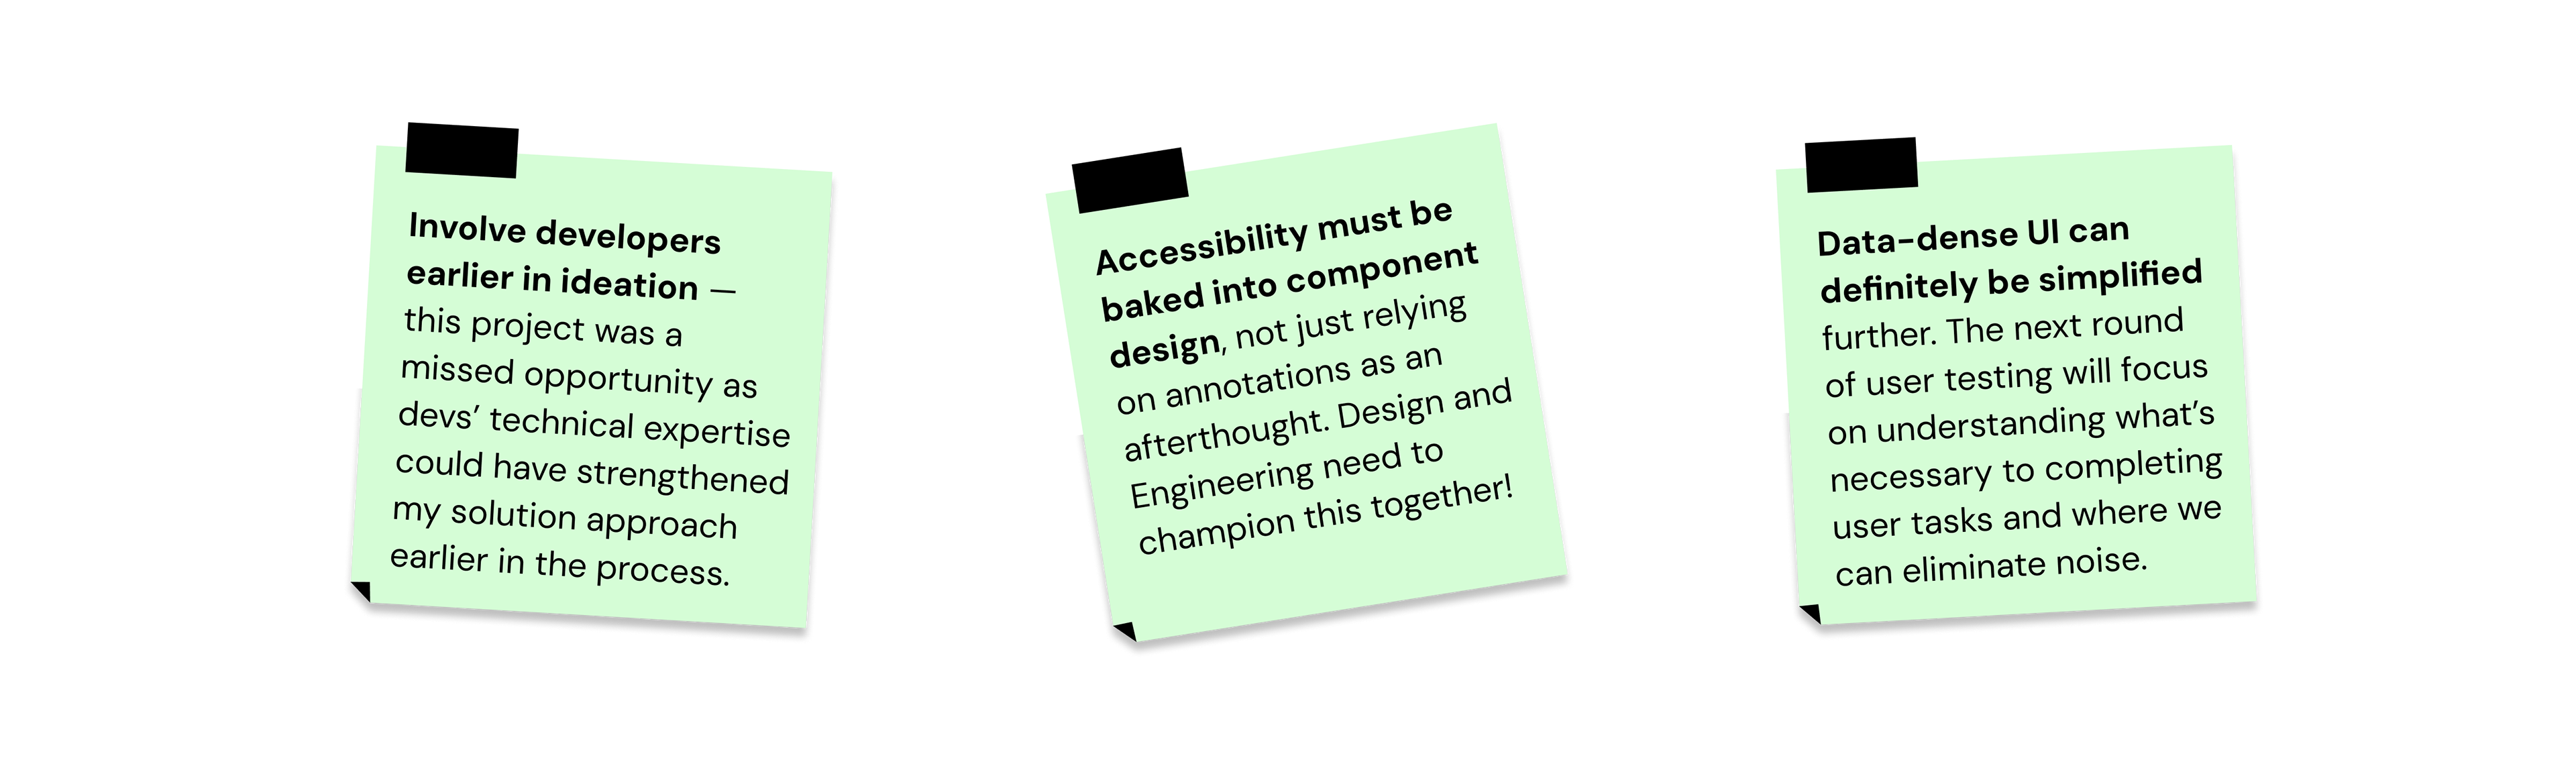
Learnings