Validating the redesign of a staff product to score customers on their environmental impact
Conducting rapid discovery and evaluation to validate an investment into redesigning a staff product to manually score organisations on their environmental performance
(5-8 minute read)
Overview
Duration: 4 weeks
Project team: Product Designer (lead, me),
Senior UX Researcher (supporting)
Senior UX Researcher (supporting)
Stakeholders: Head of Product, Product Owner, Lead Engineer, Head of staff product (scoring)
Objective: Exploring staff product user needs and evaluating the cost-benefit of proposed changes
Design methods: Journey mapping, screen flows, heuristics review, ideation workshop, concept design, wireframing, t-shirt sizing estimation
Research methods: Product data analytics, user interviews, concept testing, data analysis
Problem
Can we significantly improve the efficiency of our internal users by implementing UX/UI changes to the staff product?
It currently costs the business £1,000,000 + 7 weeks of staff work to carry out manual scoring, which is a key business value and must be retained. However, to scale to 100,000 customers in line with our strategic objectives would cost 4x more with the current product design and process.
Business objective: Reduce the cost without compromising the output.

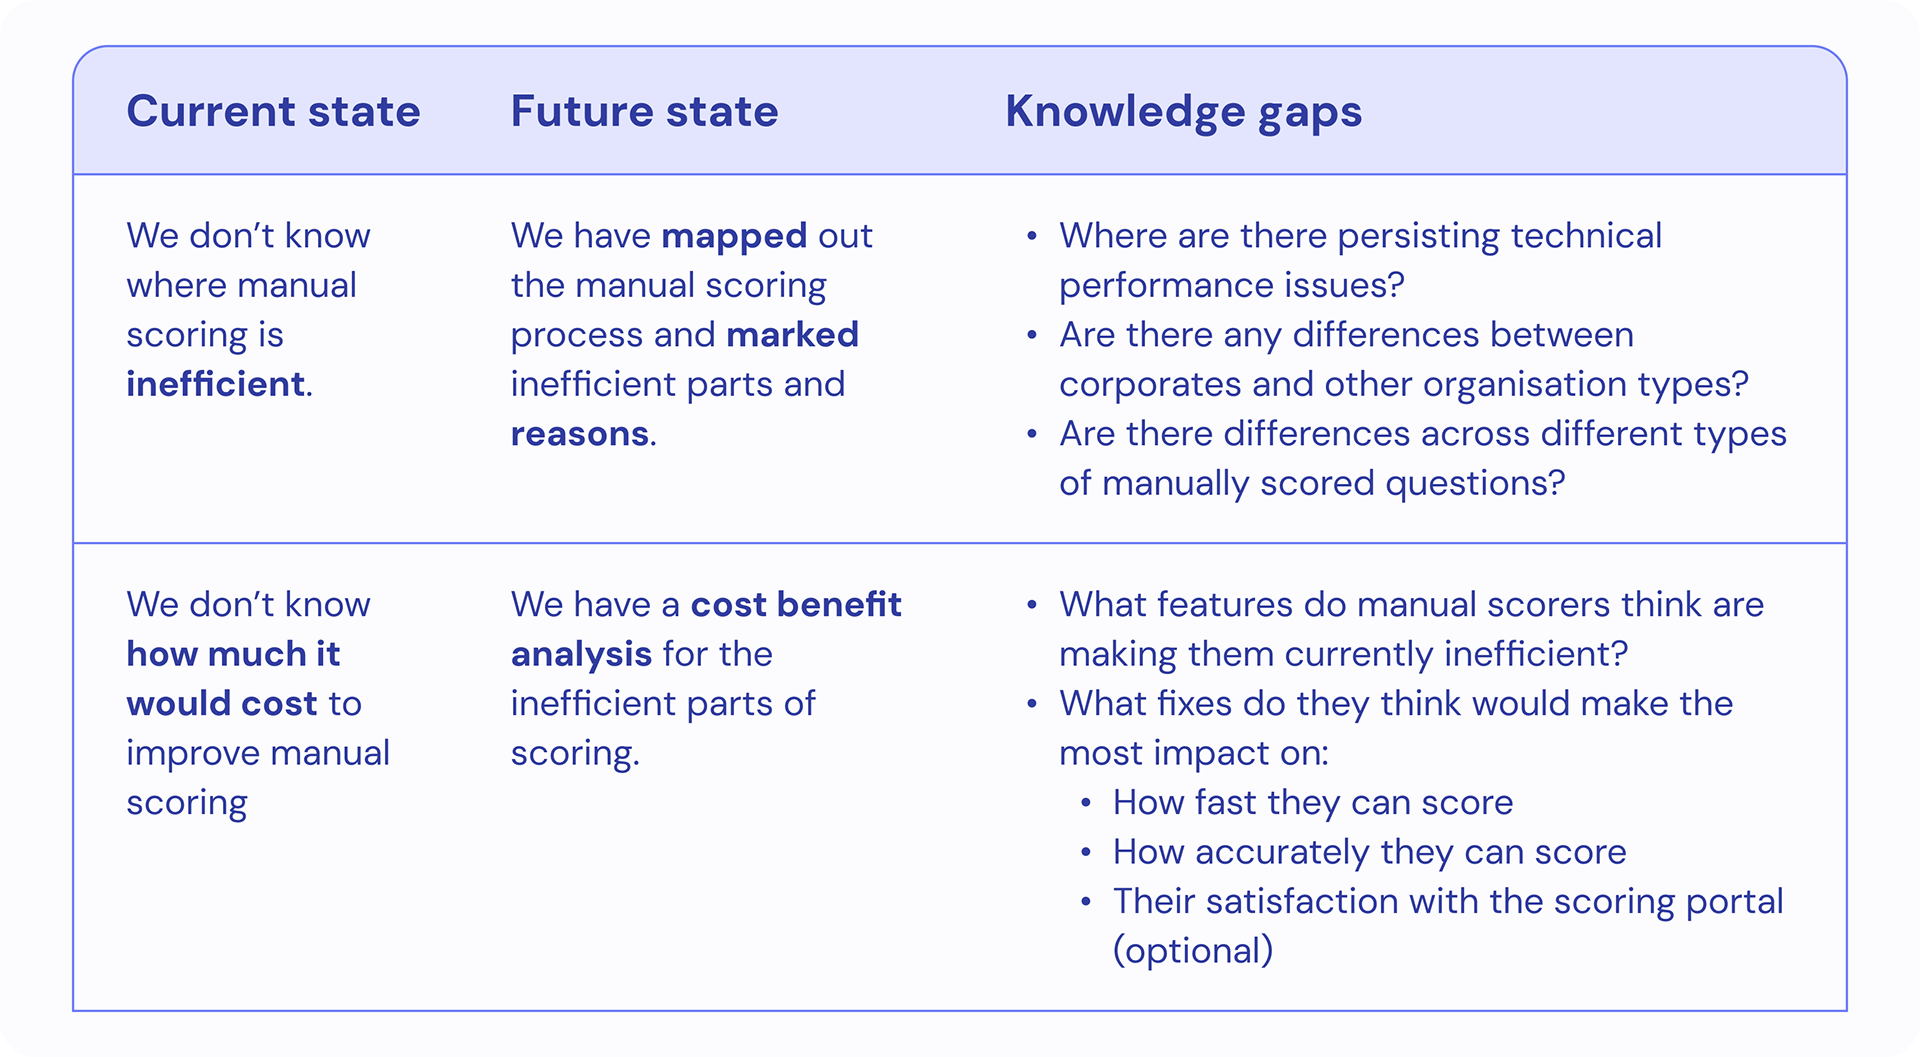
Plan
Based on the problem given, I prepared a project plan of activities to carry out to reach our objectives, including a breakdown of where we should be by the end of the project.
Discovery (~1.5 weeks)
Goal: Identify slowest/most frustrating parts of the manual scoring flow.
Design method: Journey mapping, screen flows, heuristics review
Research method: Data analytics, 1:1 user interviews
Design and test (~2 weeks)
Goal: Create concepts to address biggest pain points in the flow. Validate concepts with users and engineers on how manual scoring could be sped up.
Design method: Ideation workshop, concept design, wireframing
Research method: Unmoderated study - concept testing
Reflect and present (~1-3 days)
Goal: Present a soft estimate of whether usability solutions are worth investing further
Design method: T-shirt sizing estimation
Research method: Data analysis and synthesis
Discovery
The focus of this stage was to identify the most problematic areas of the existing manual scoring flow and hence, opportunities.
Activities with links to full artefacts (opens in new tab):
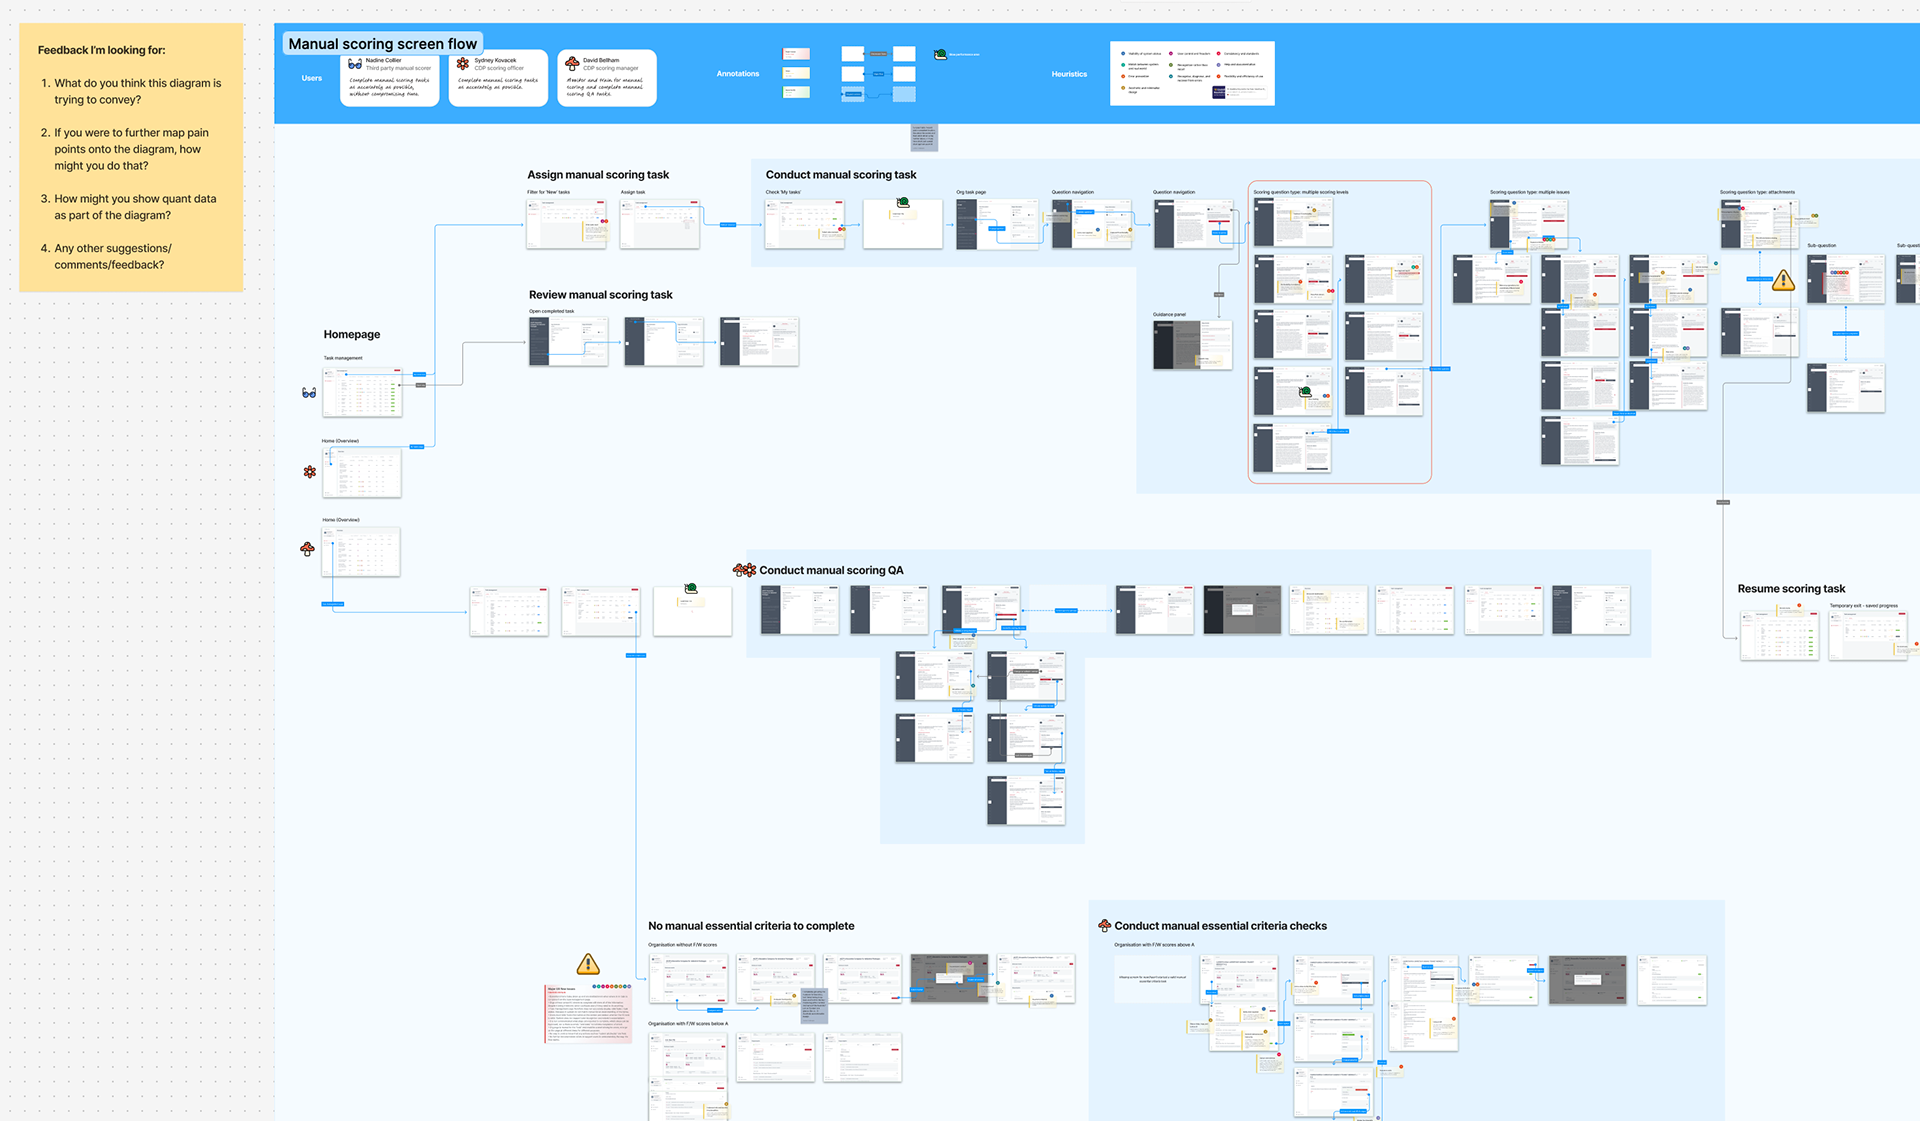
• Screen flow mapping of the current E2E journey of manual scoring to address the logic of steps
• Evaluate heuristics of UX/UI to benchmark existing usability against best practices
• Data analysis of product and user metrics from FullStory to capture quantitative insights
• User interviews to understand more deeply about users’ experiences and draw out qualitative
insights
insights
User interviews
I recruited and interviewed users in 45 min, 1:1 sessions. Together with our Researcher, we tested how well the scoring portal supported manual scoring based on known issues and hypotheses.
We focused on:
• Inefficiencies in the flow
• How well the portal’s structure aligned with users' mental models (i.e. order of decisions,
appropriateness of guidance, navigation to and between tasks)
appropriateness of guidance, navigation to and between tasks)
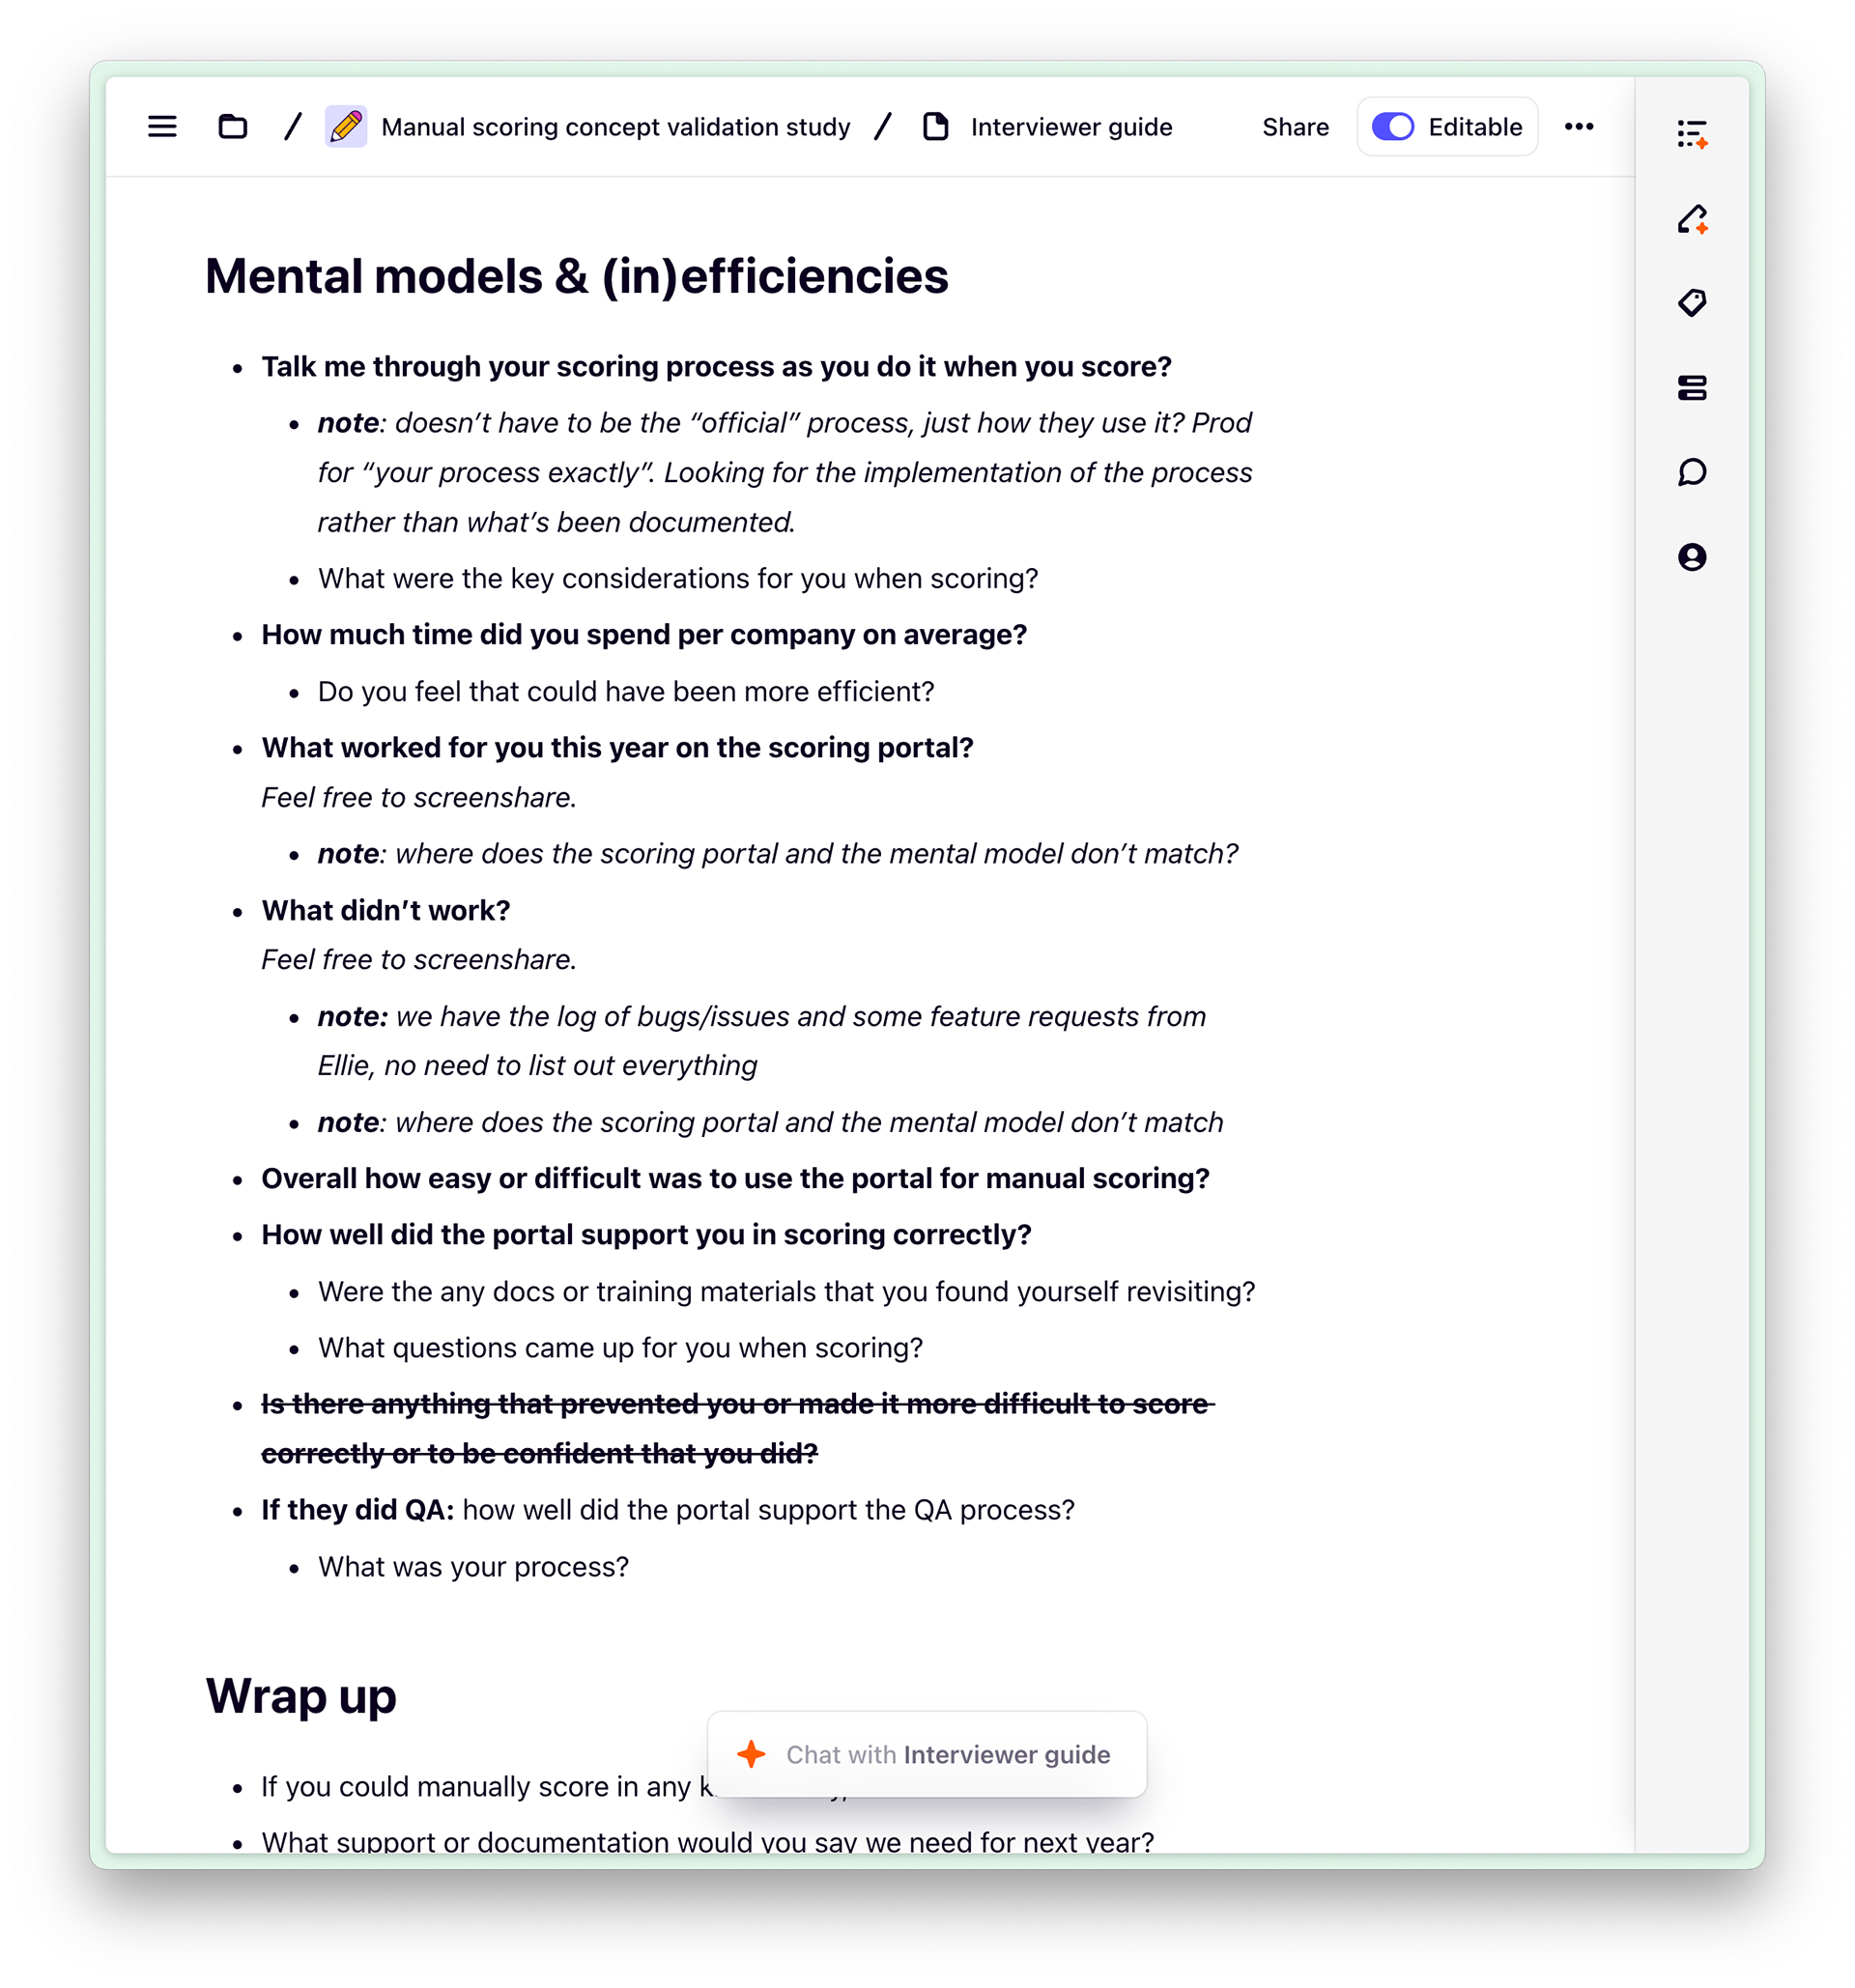
Discussion guide for user interviews
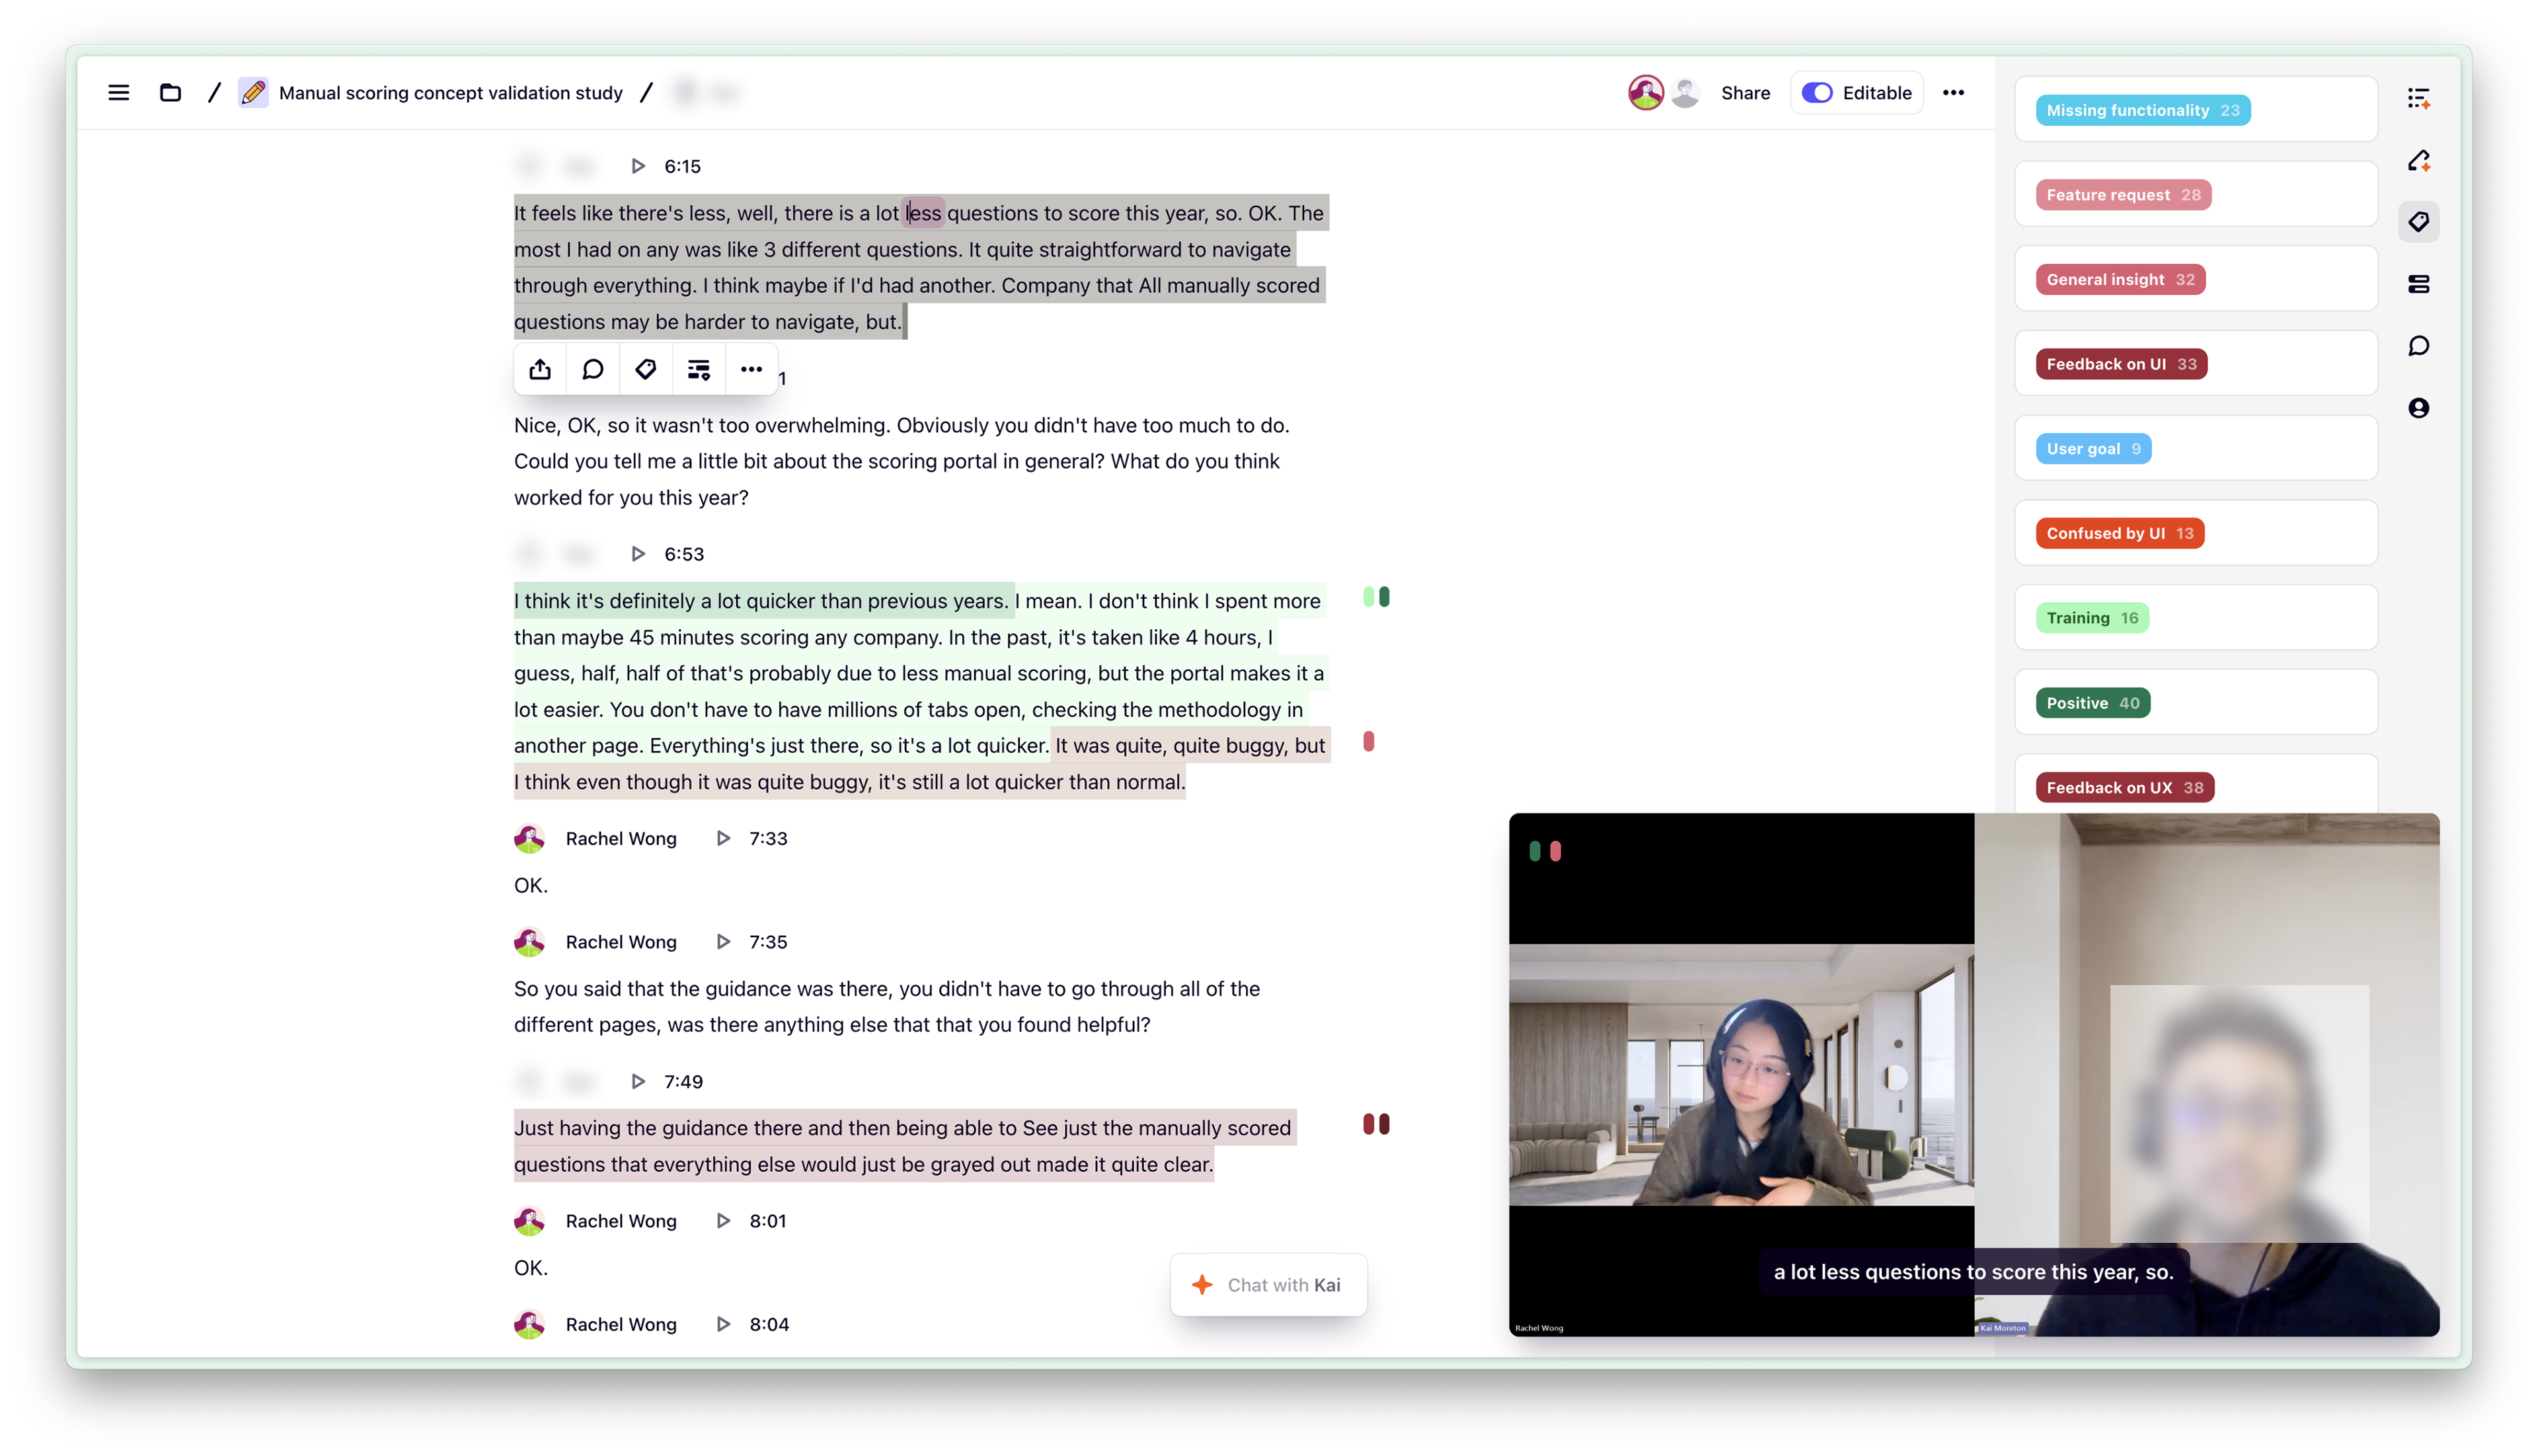
Recorded user interview with coded (tagged) transcription
These research insights led me to envision new concepts for improving the manual scoring portal.
Design and test
Ideation
I facilitated an ideation workshop with the Design team, presenting them with three 'How might we' problem statements to choose from, based on the top three themes identified in Discovery. Each brief came with to research nuggets to better understand the user problems and needs.
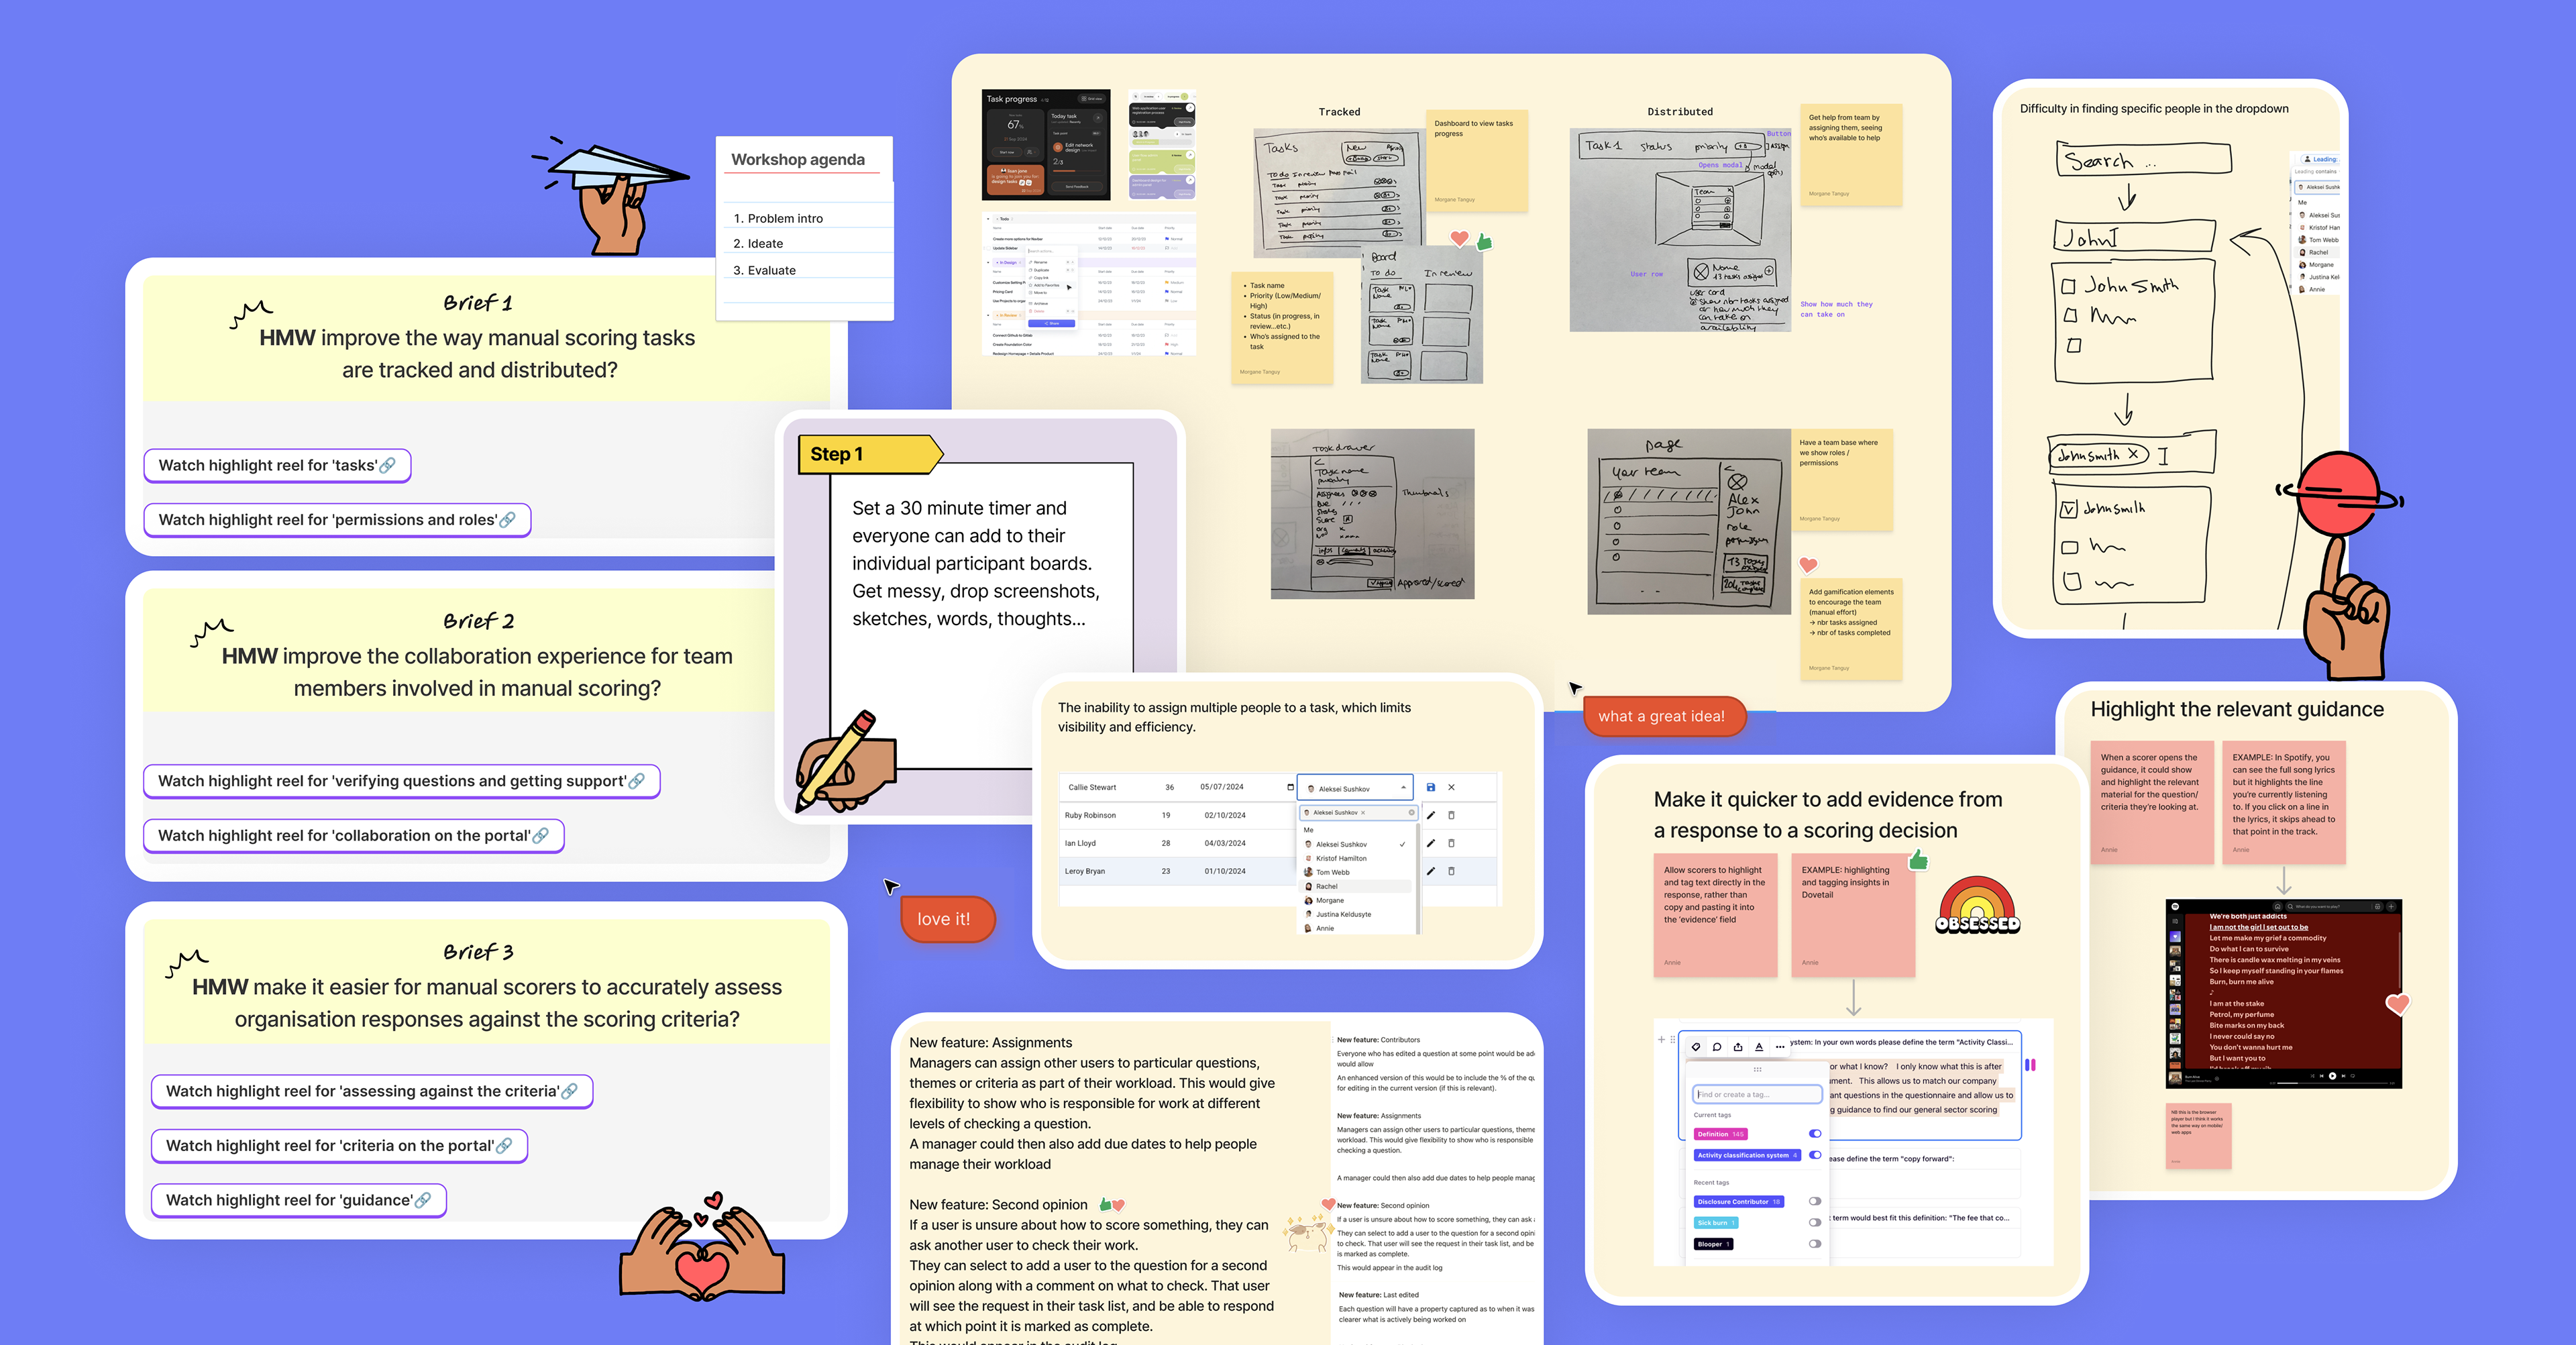
Excerpts from the ideation workshop, including the original briefs and samples of ideas from the team!
As always, I was impressed with the creativity in my team! I consolidated these ideas to determine what the concepts would look like to be tested with users.
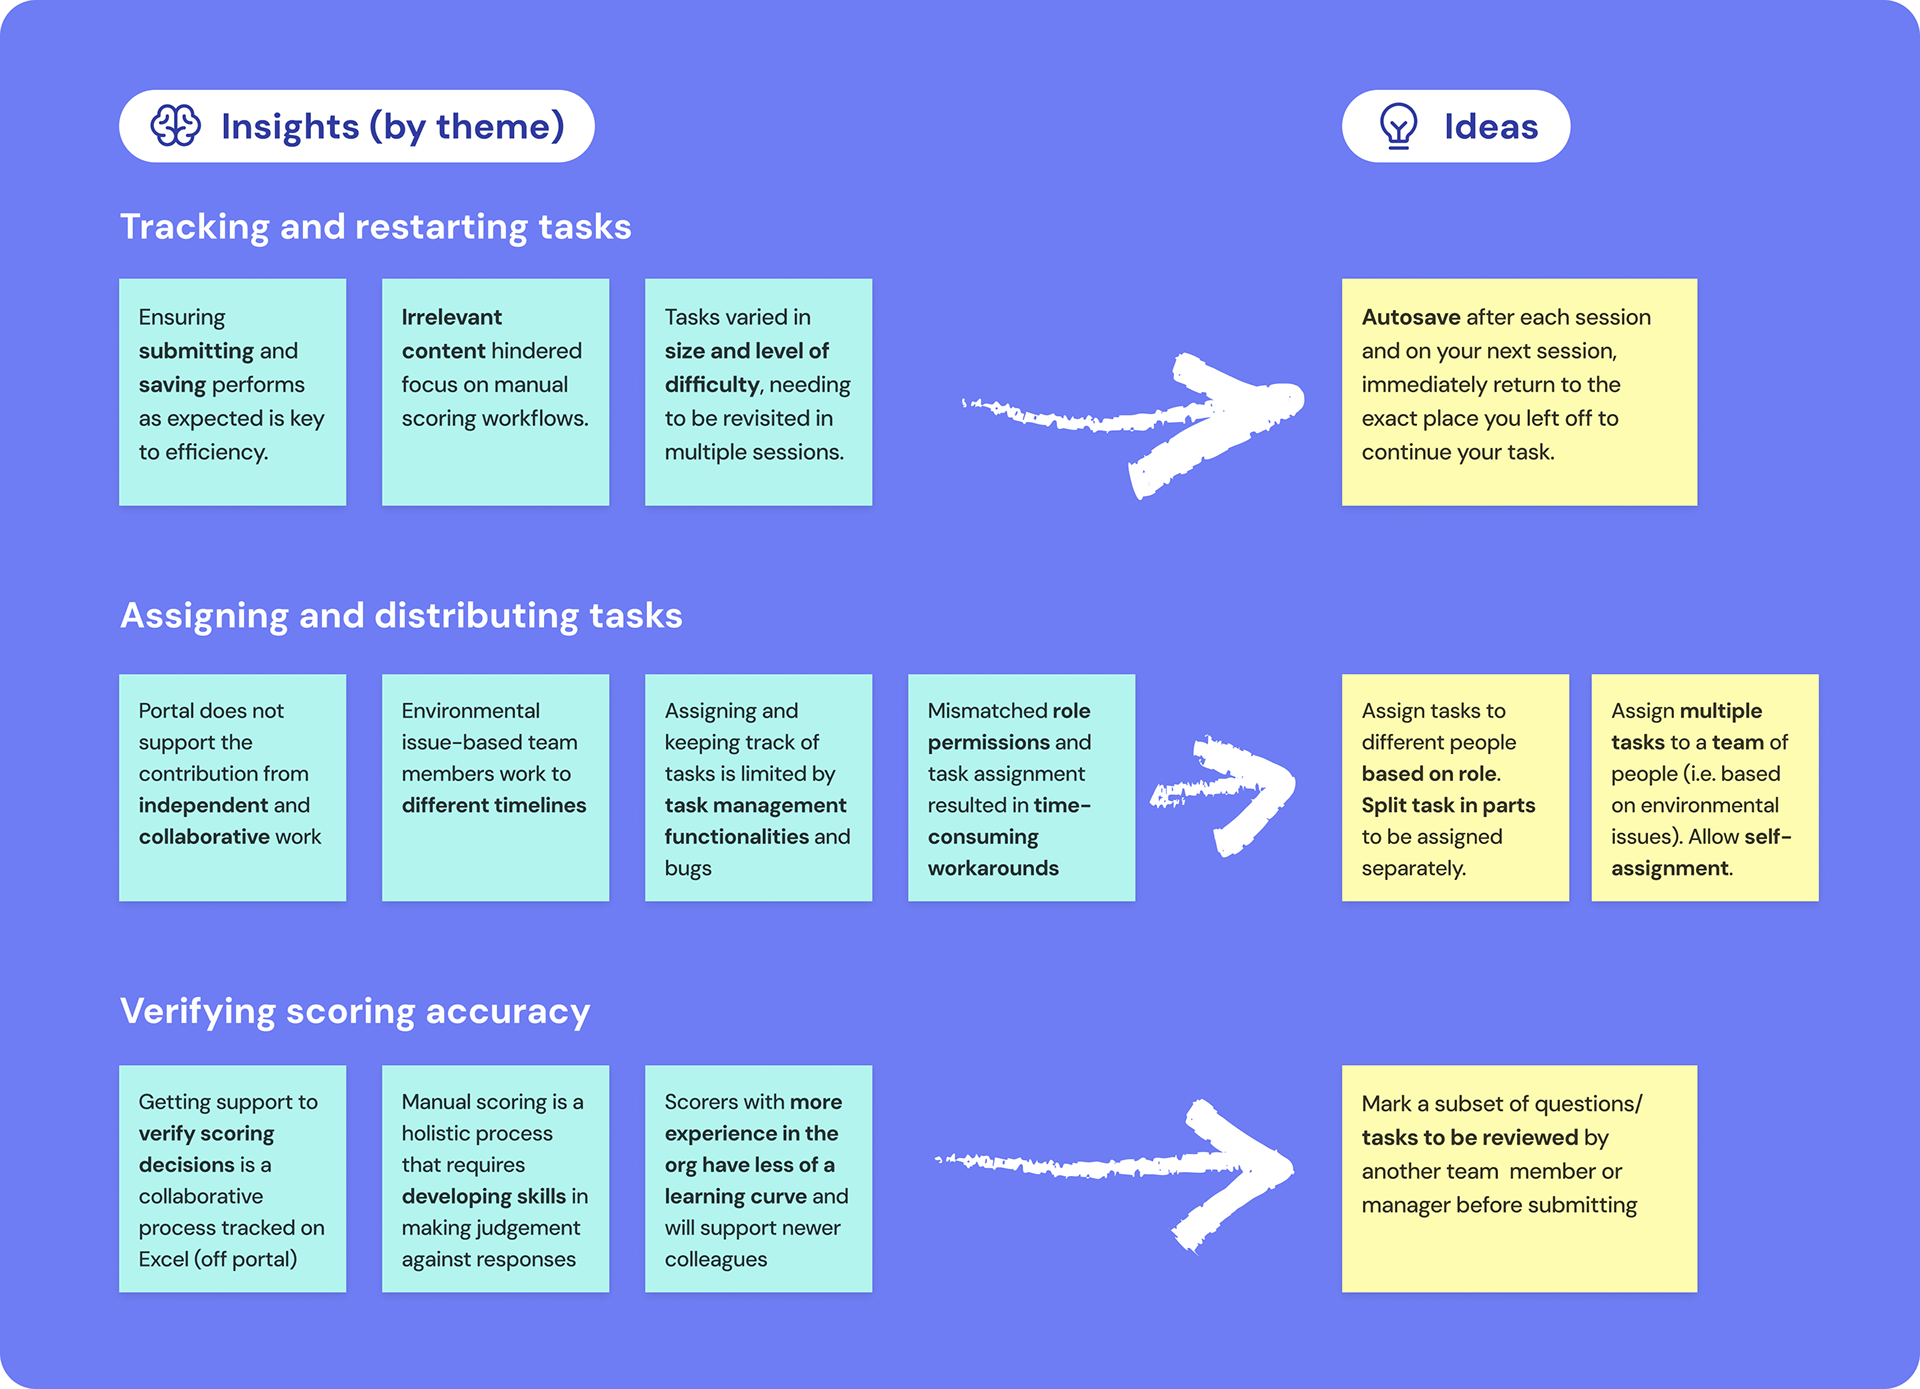
Each insight theme was paired with the winning idea based on consolidation of the ideation workshop
Because there was a collection of insights about the main manual scoring interface, I took a different approach and created a higher fidelity wireframe design to be tested as the fourth concept:
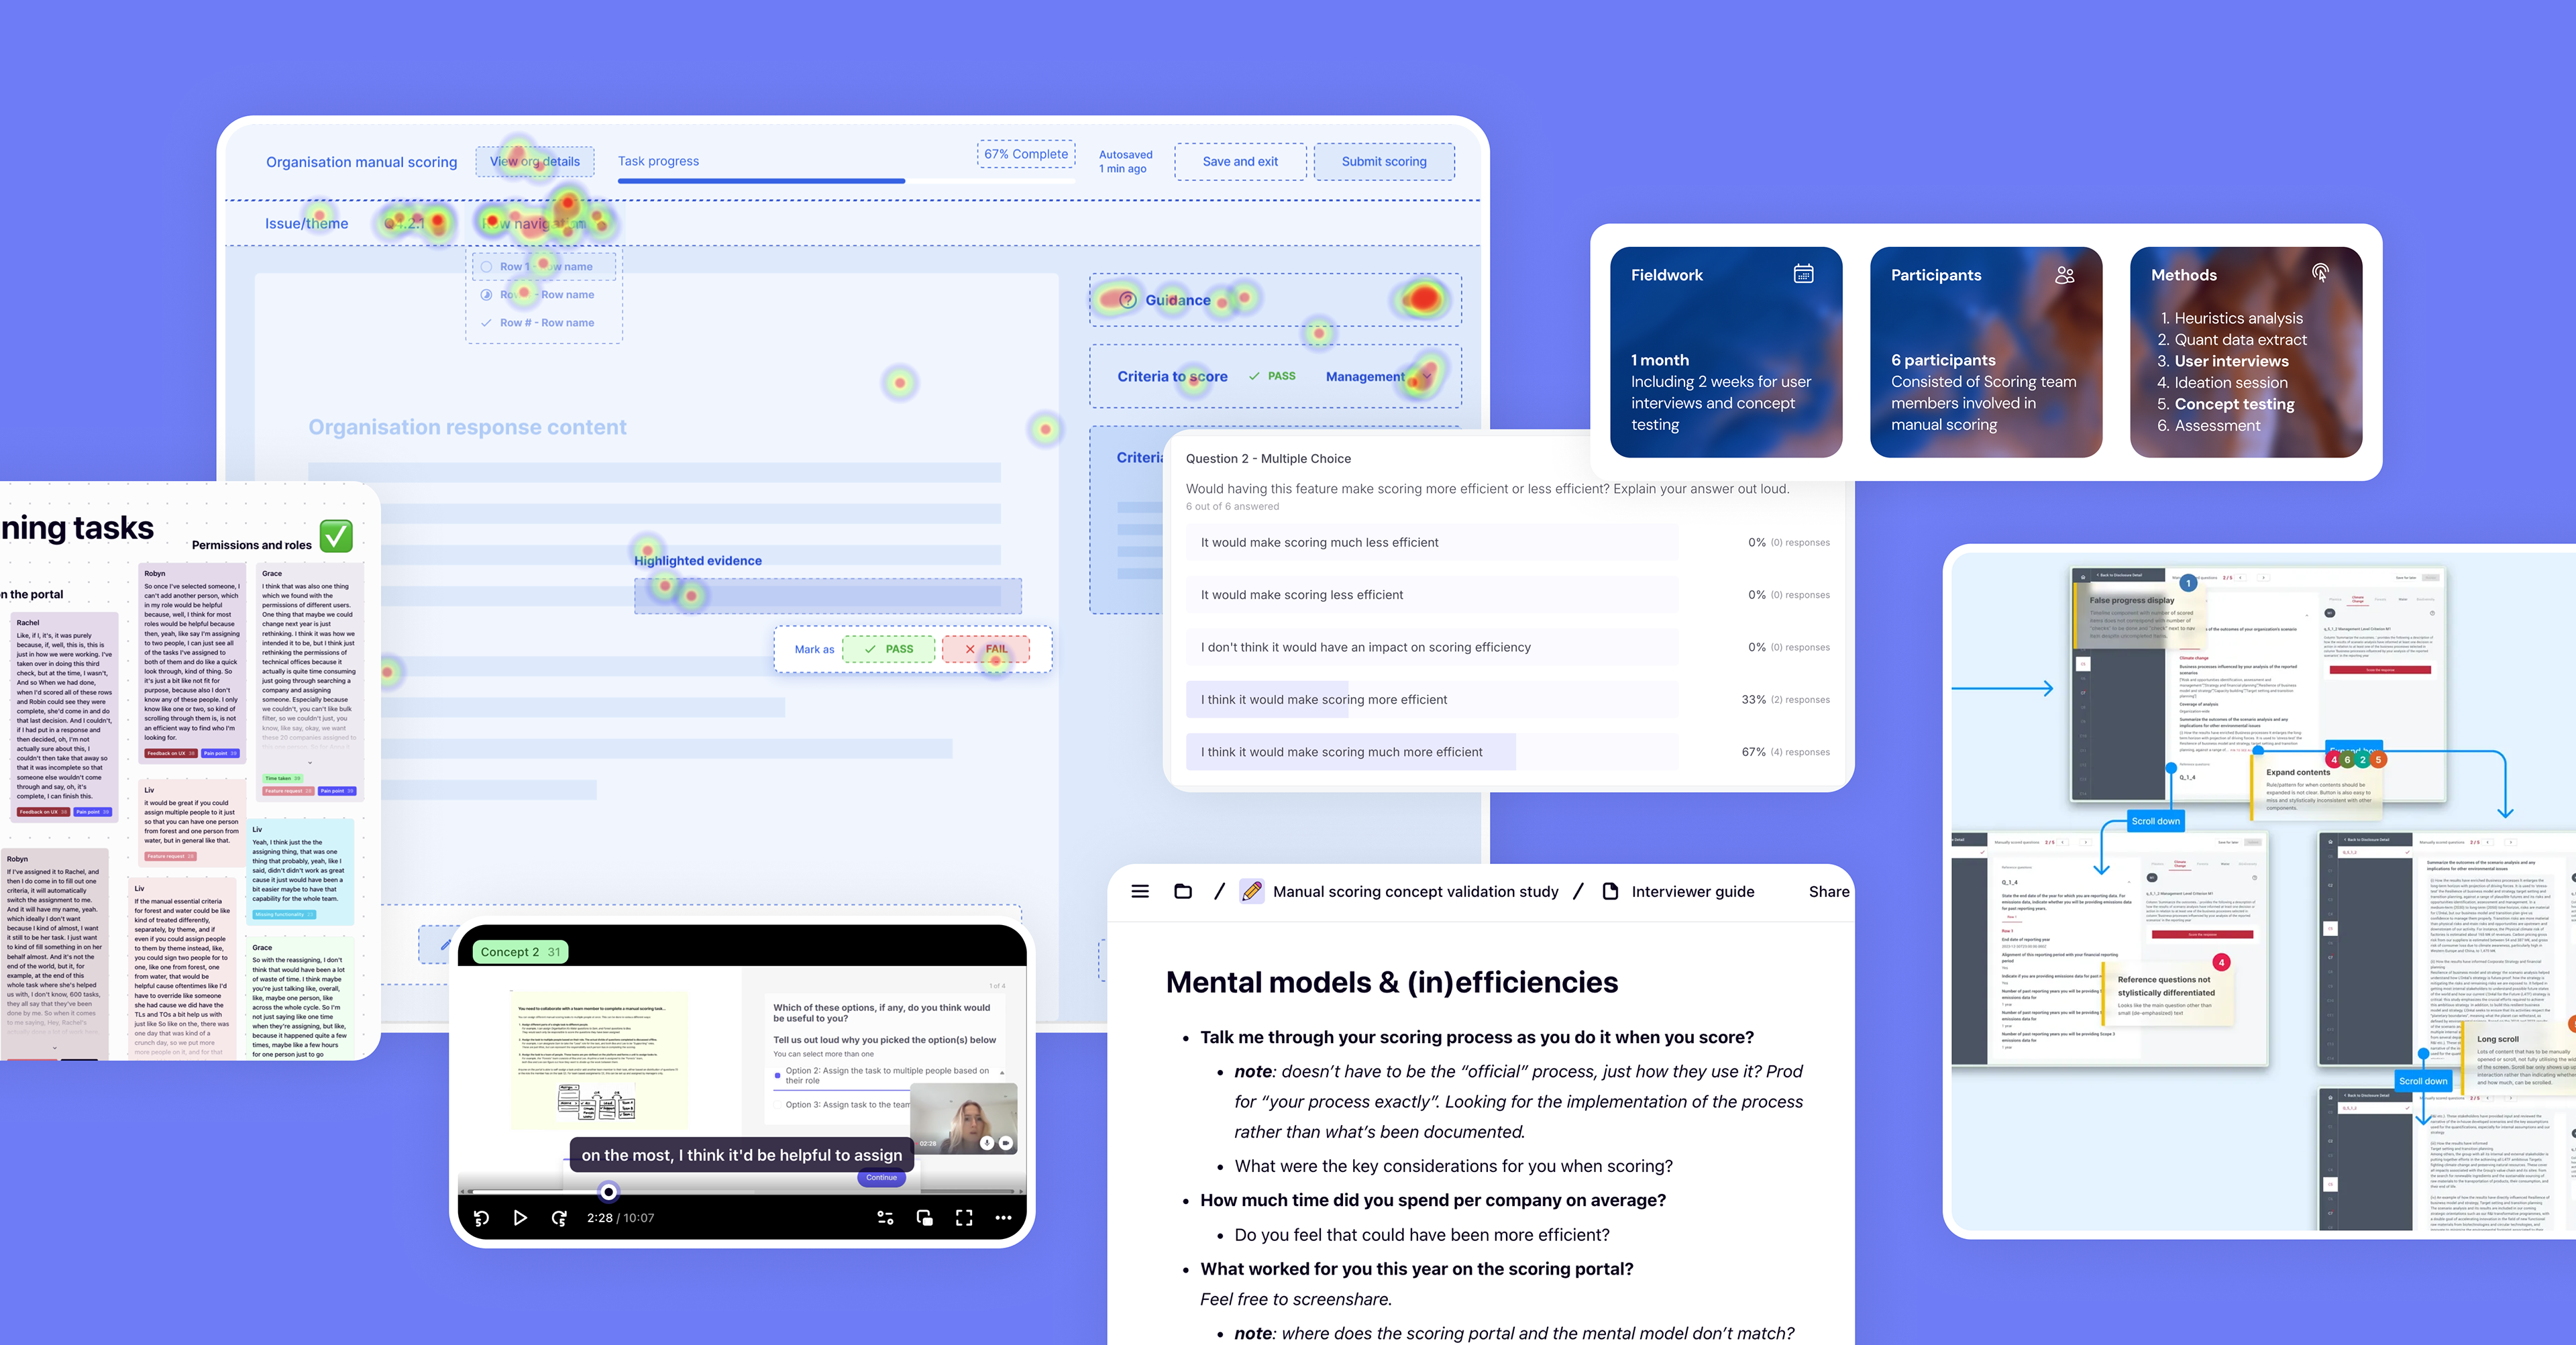
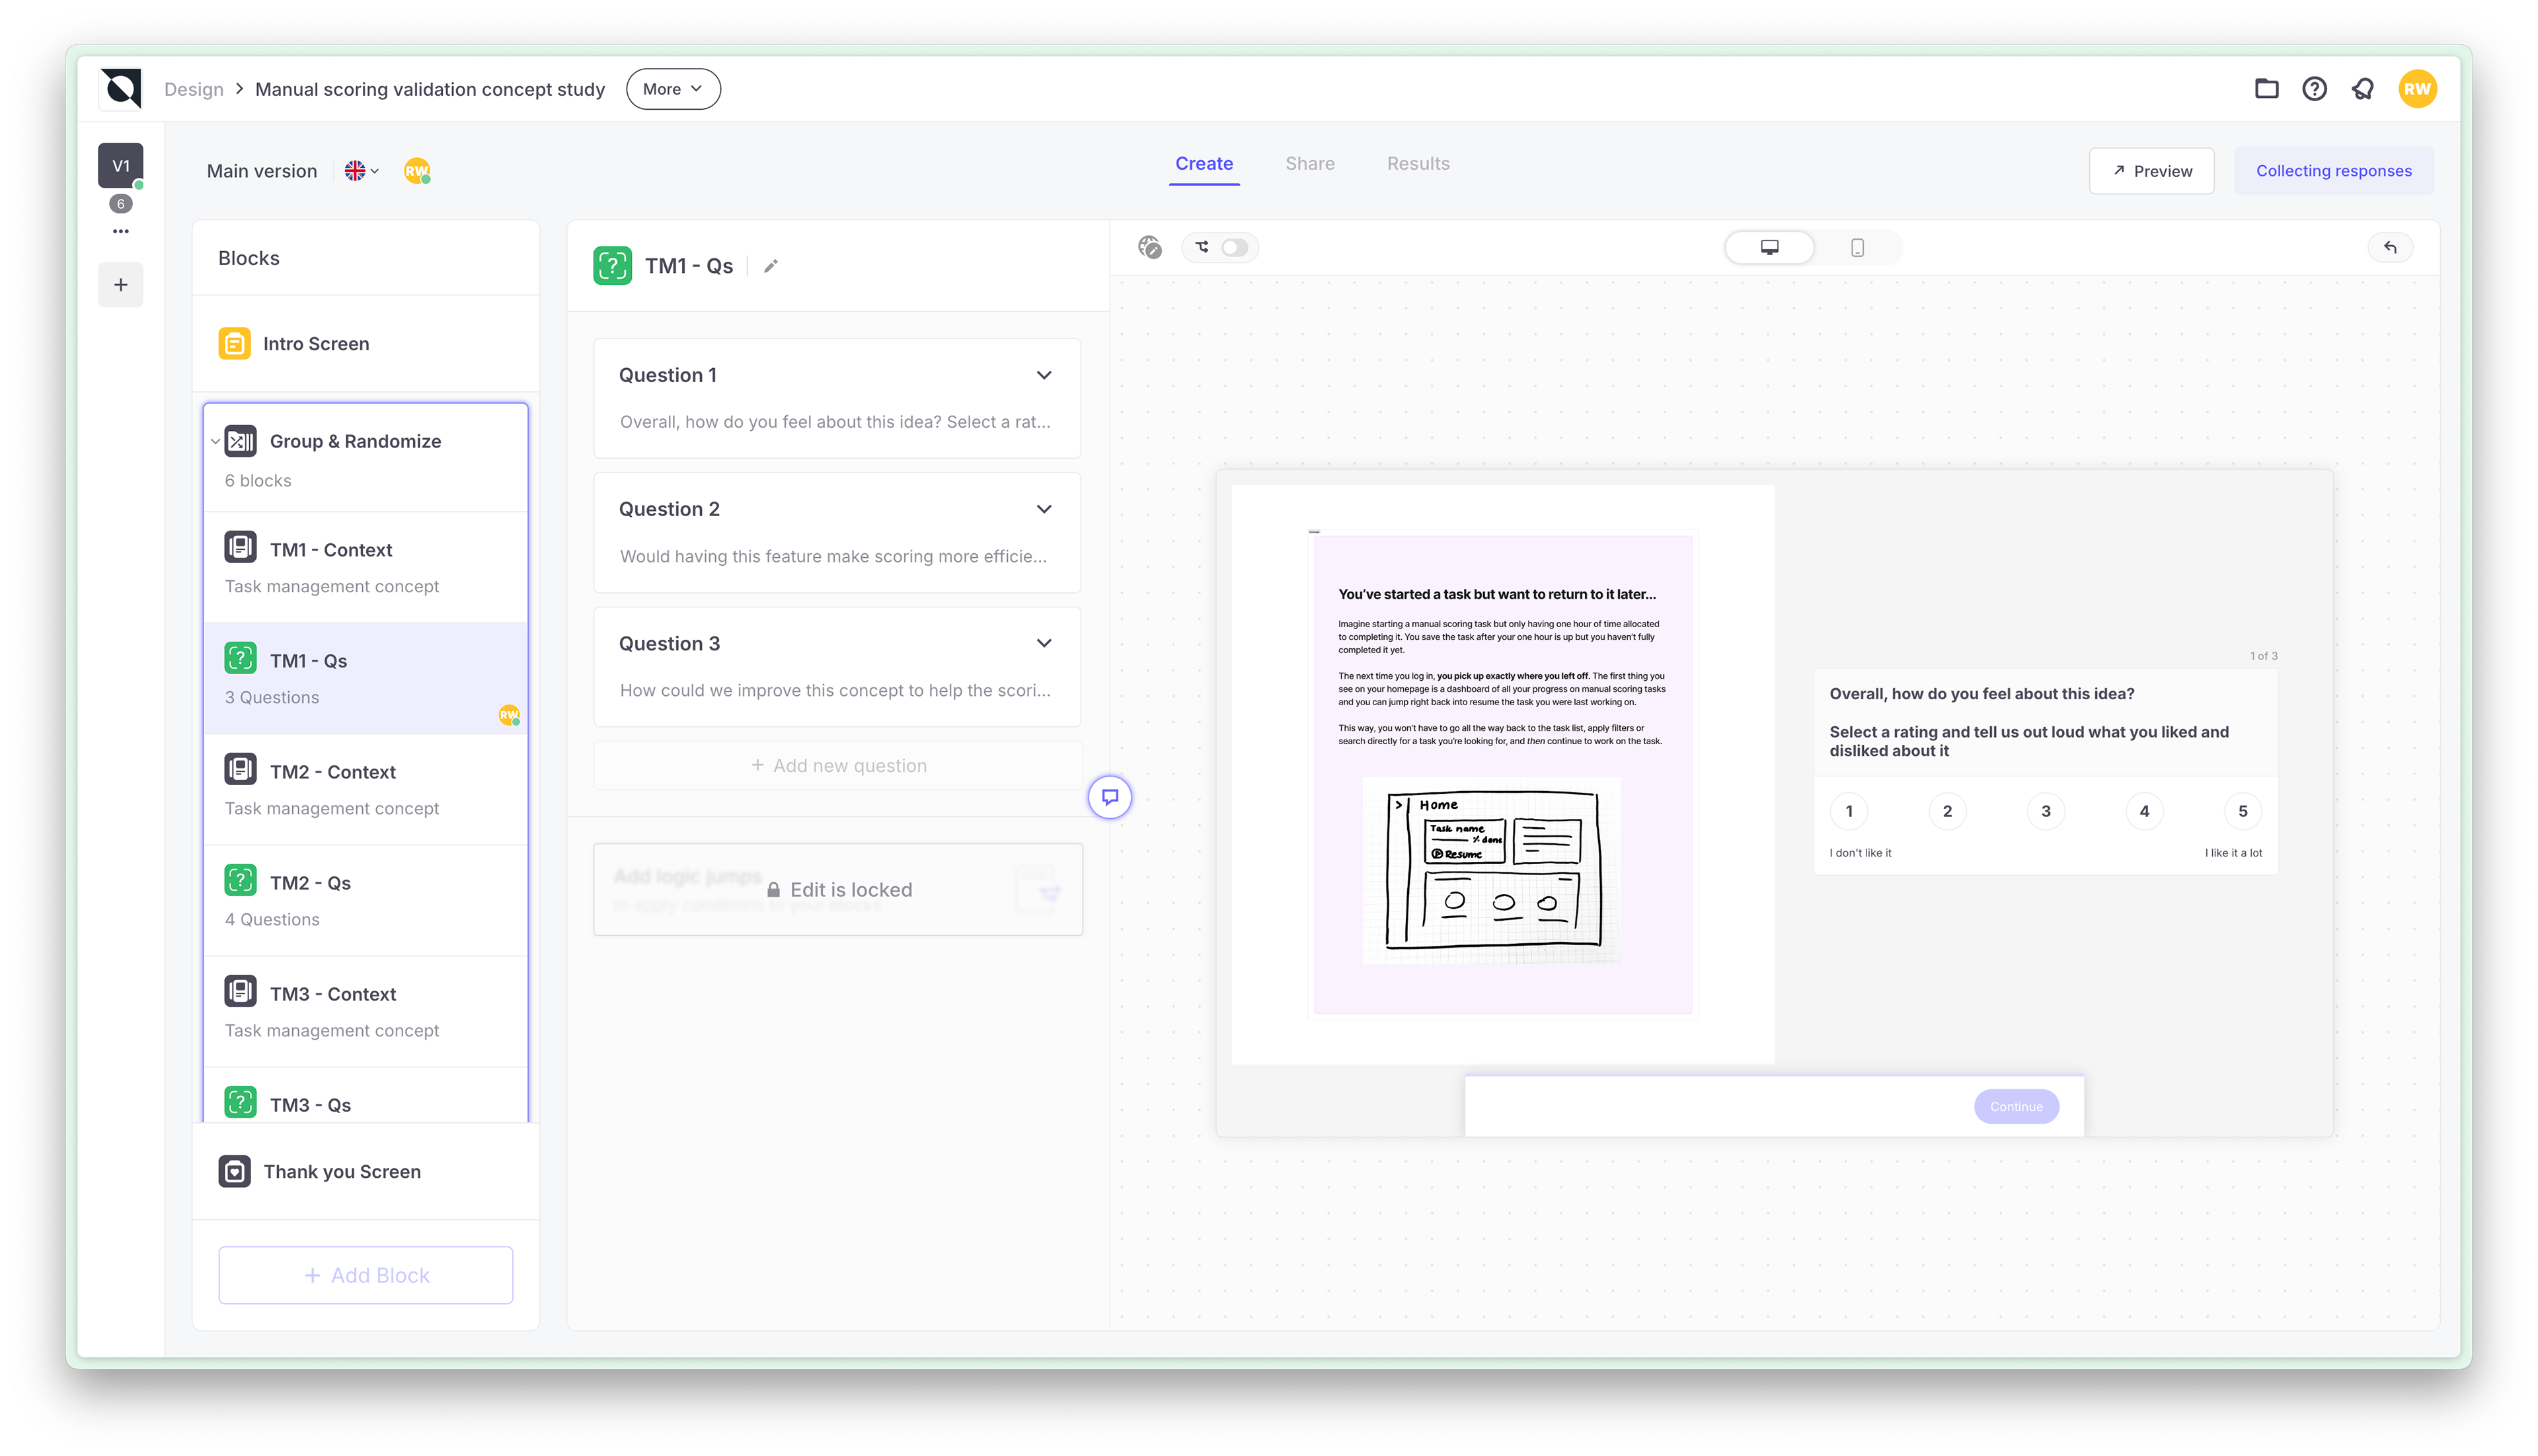
Concept validation think-out-loud study
Using Useberry (usability testing tool), together with our Researcher we built a concept validation think-out-loud study. Study set-up:
• Concept summary and low-fidelity wireframe. Followed by specific questions on general
impressions, perceived impacts on efficiency, and suggestions
impressions, perceived impacts on efficiency, and suggestions
• Set up as an unmoderated test with audio and video recording so users can take as much
natural thinking time as needed (we recommended no more than 30mins total)
natural thinking time as needed (we recommended no more than 30mins total)
• Randomising order of concepts to be evaluated to prevent first impression bias
Screenshot of usability study setup interface
Results
We can slightly improve the efficiency of users by implementing UX/UI changes to our staff product, but it will not be feasible in the short term
After the study, results were analysed and summarised to be presented to stakeholders and the wider squad. Our Lead Engineer provided t-shirt sizing estimates on how complex each concept would be to implement. This helped us measure whether the costs would be worth their expected user and business benefits.
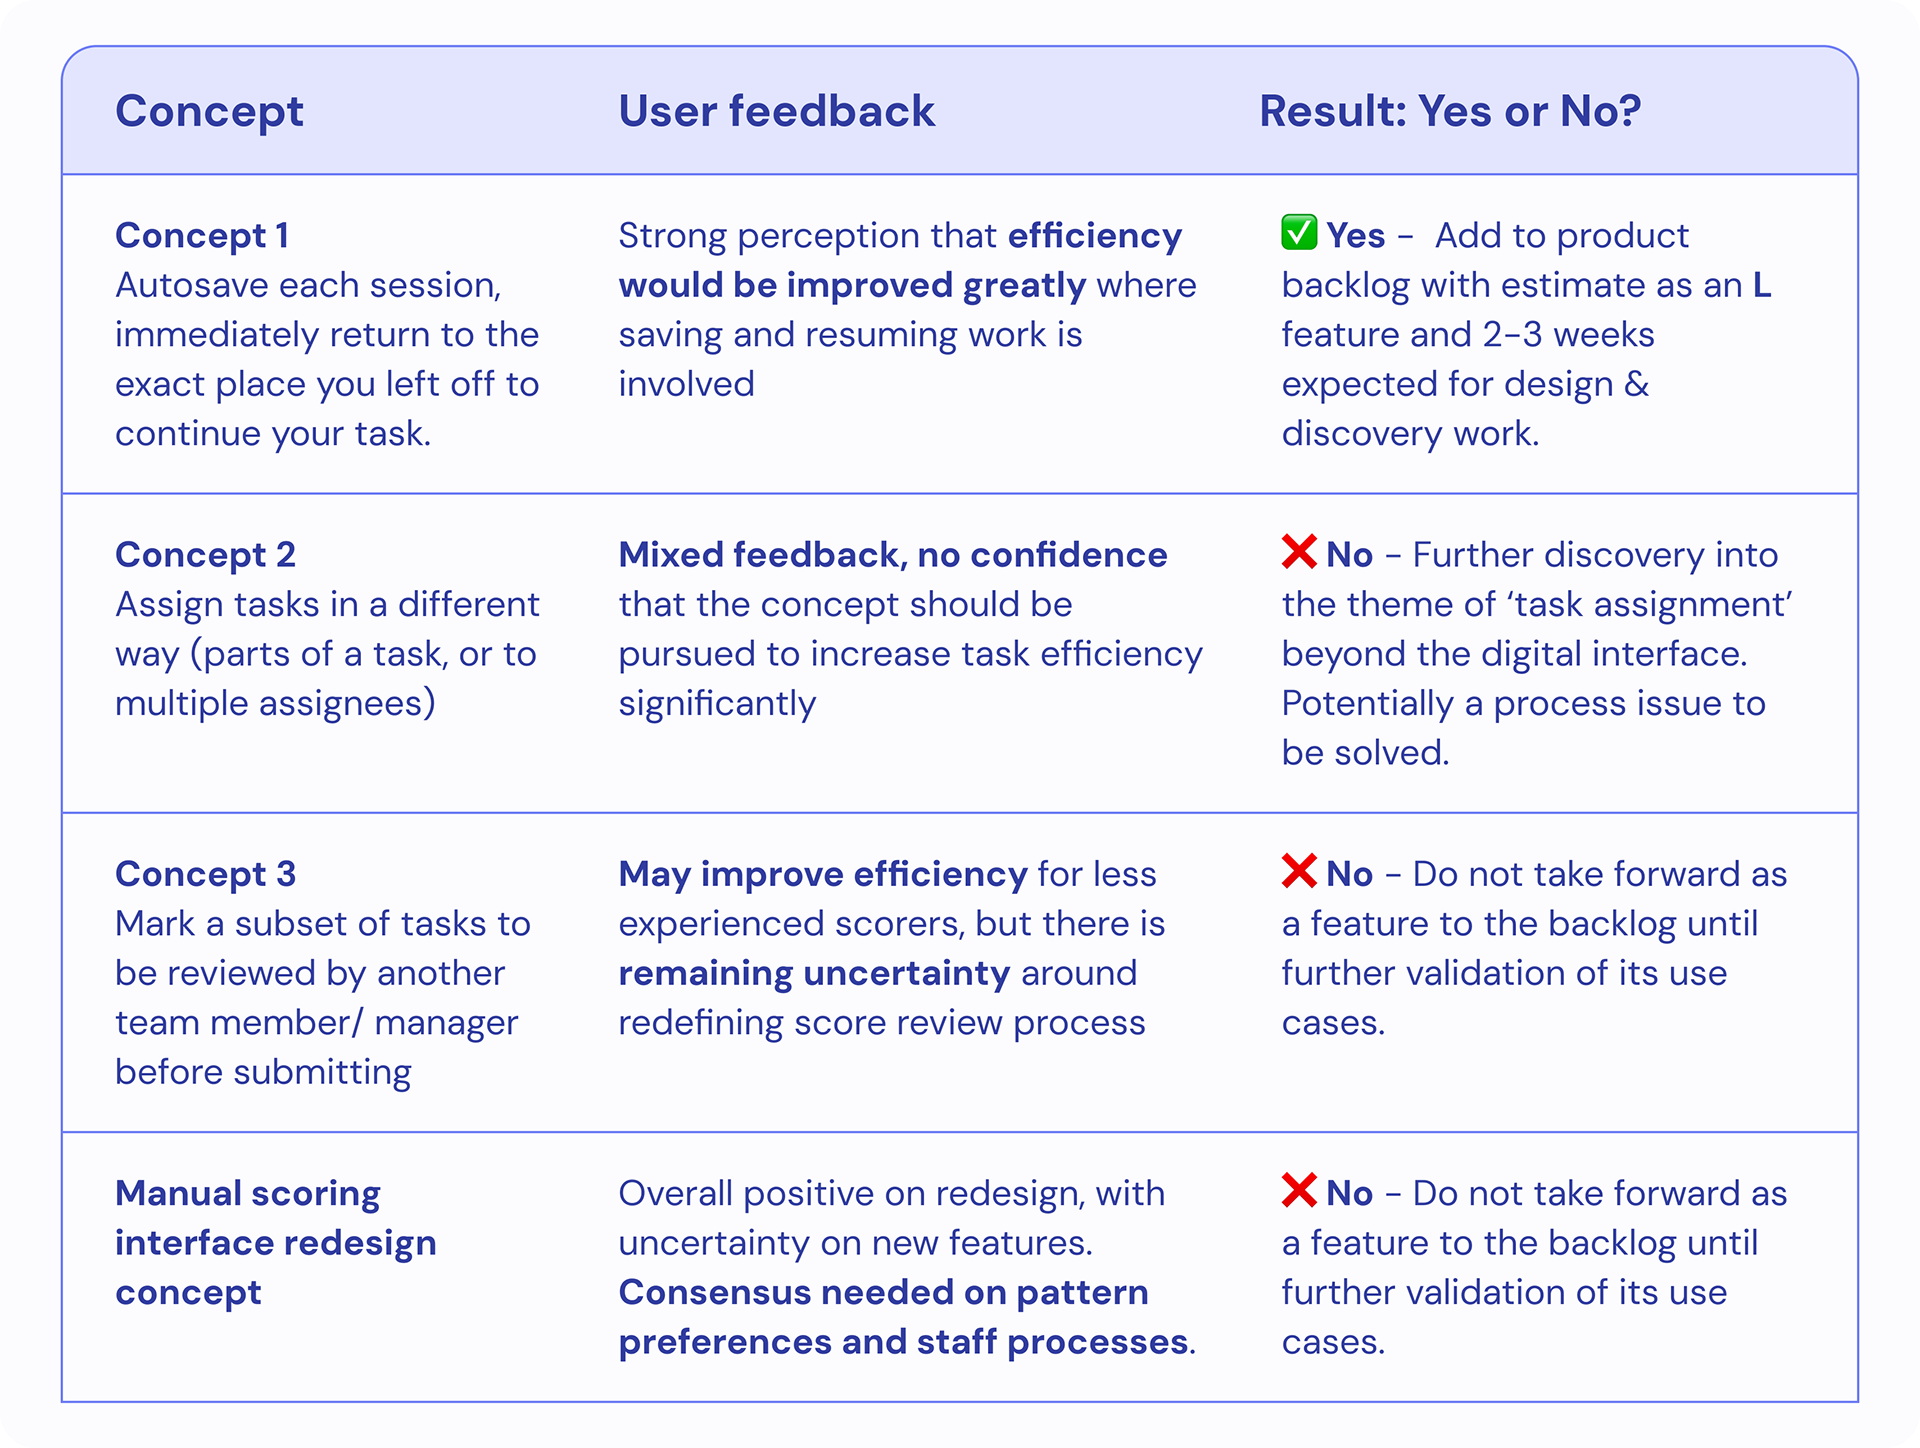
Explore the gallery of concepts and their outcomes below:
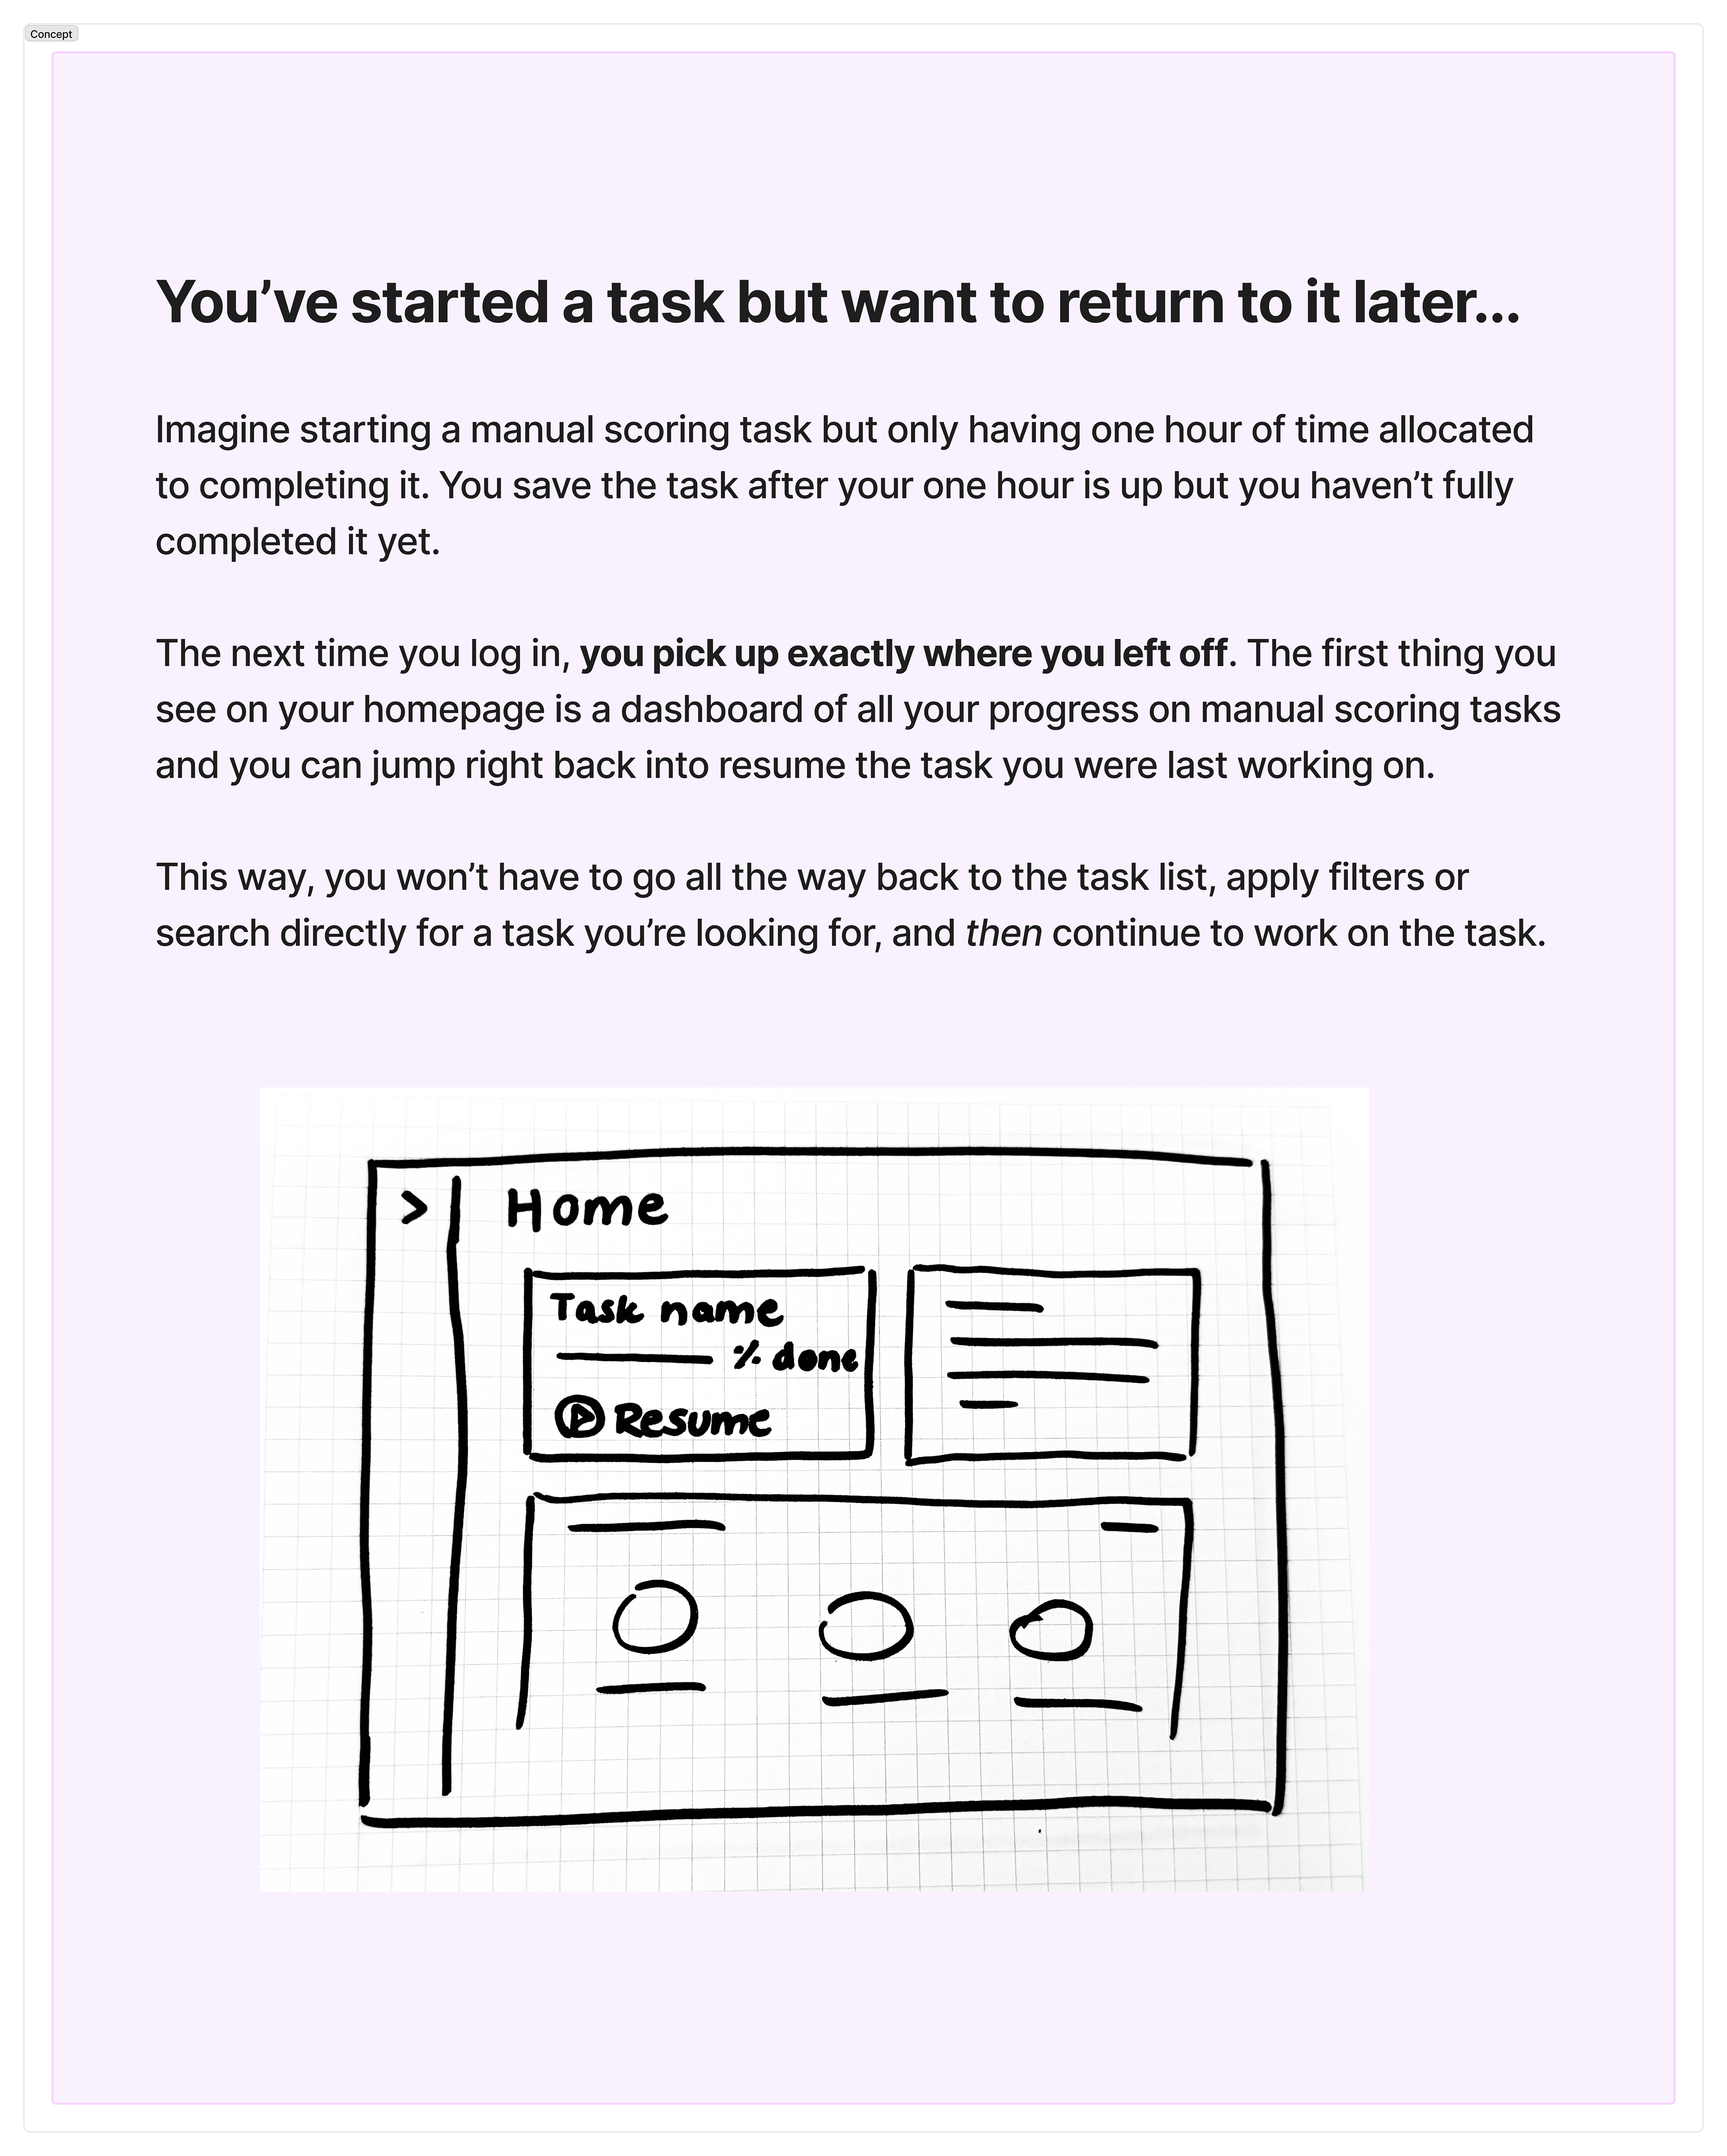
Concept 1
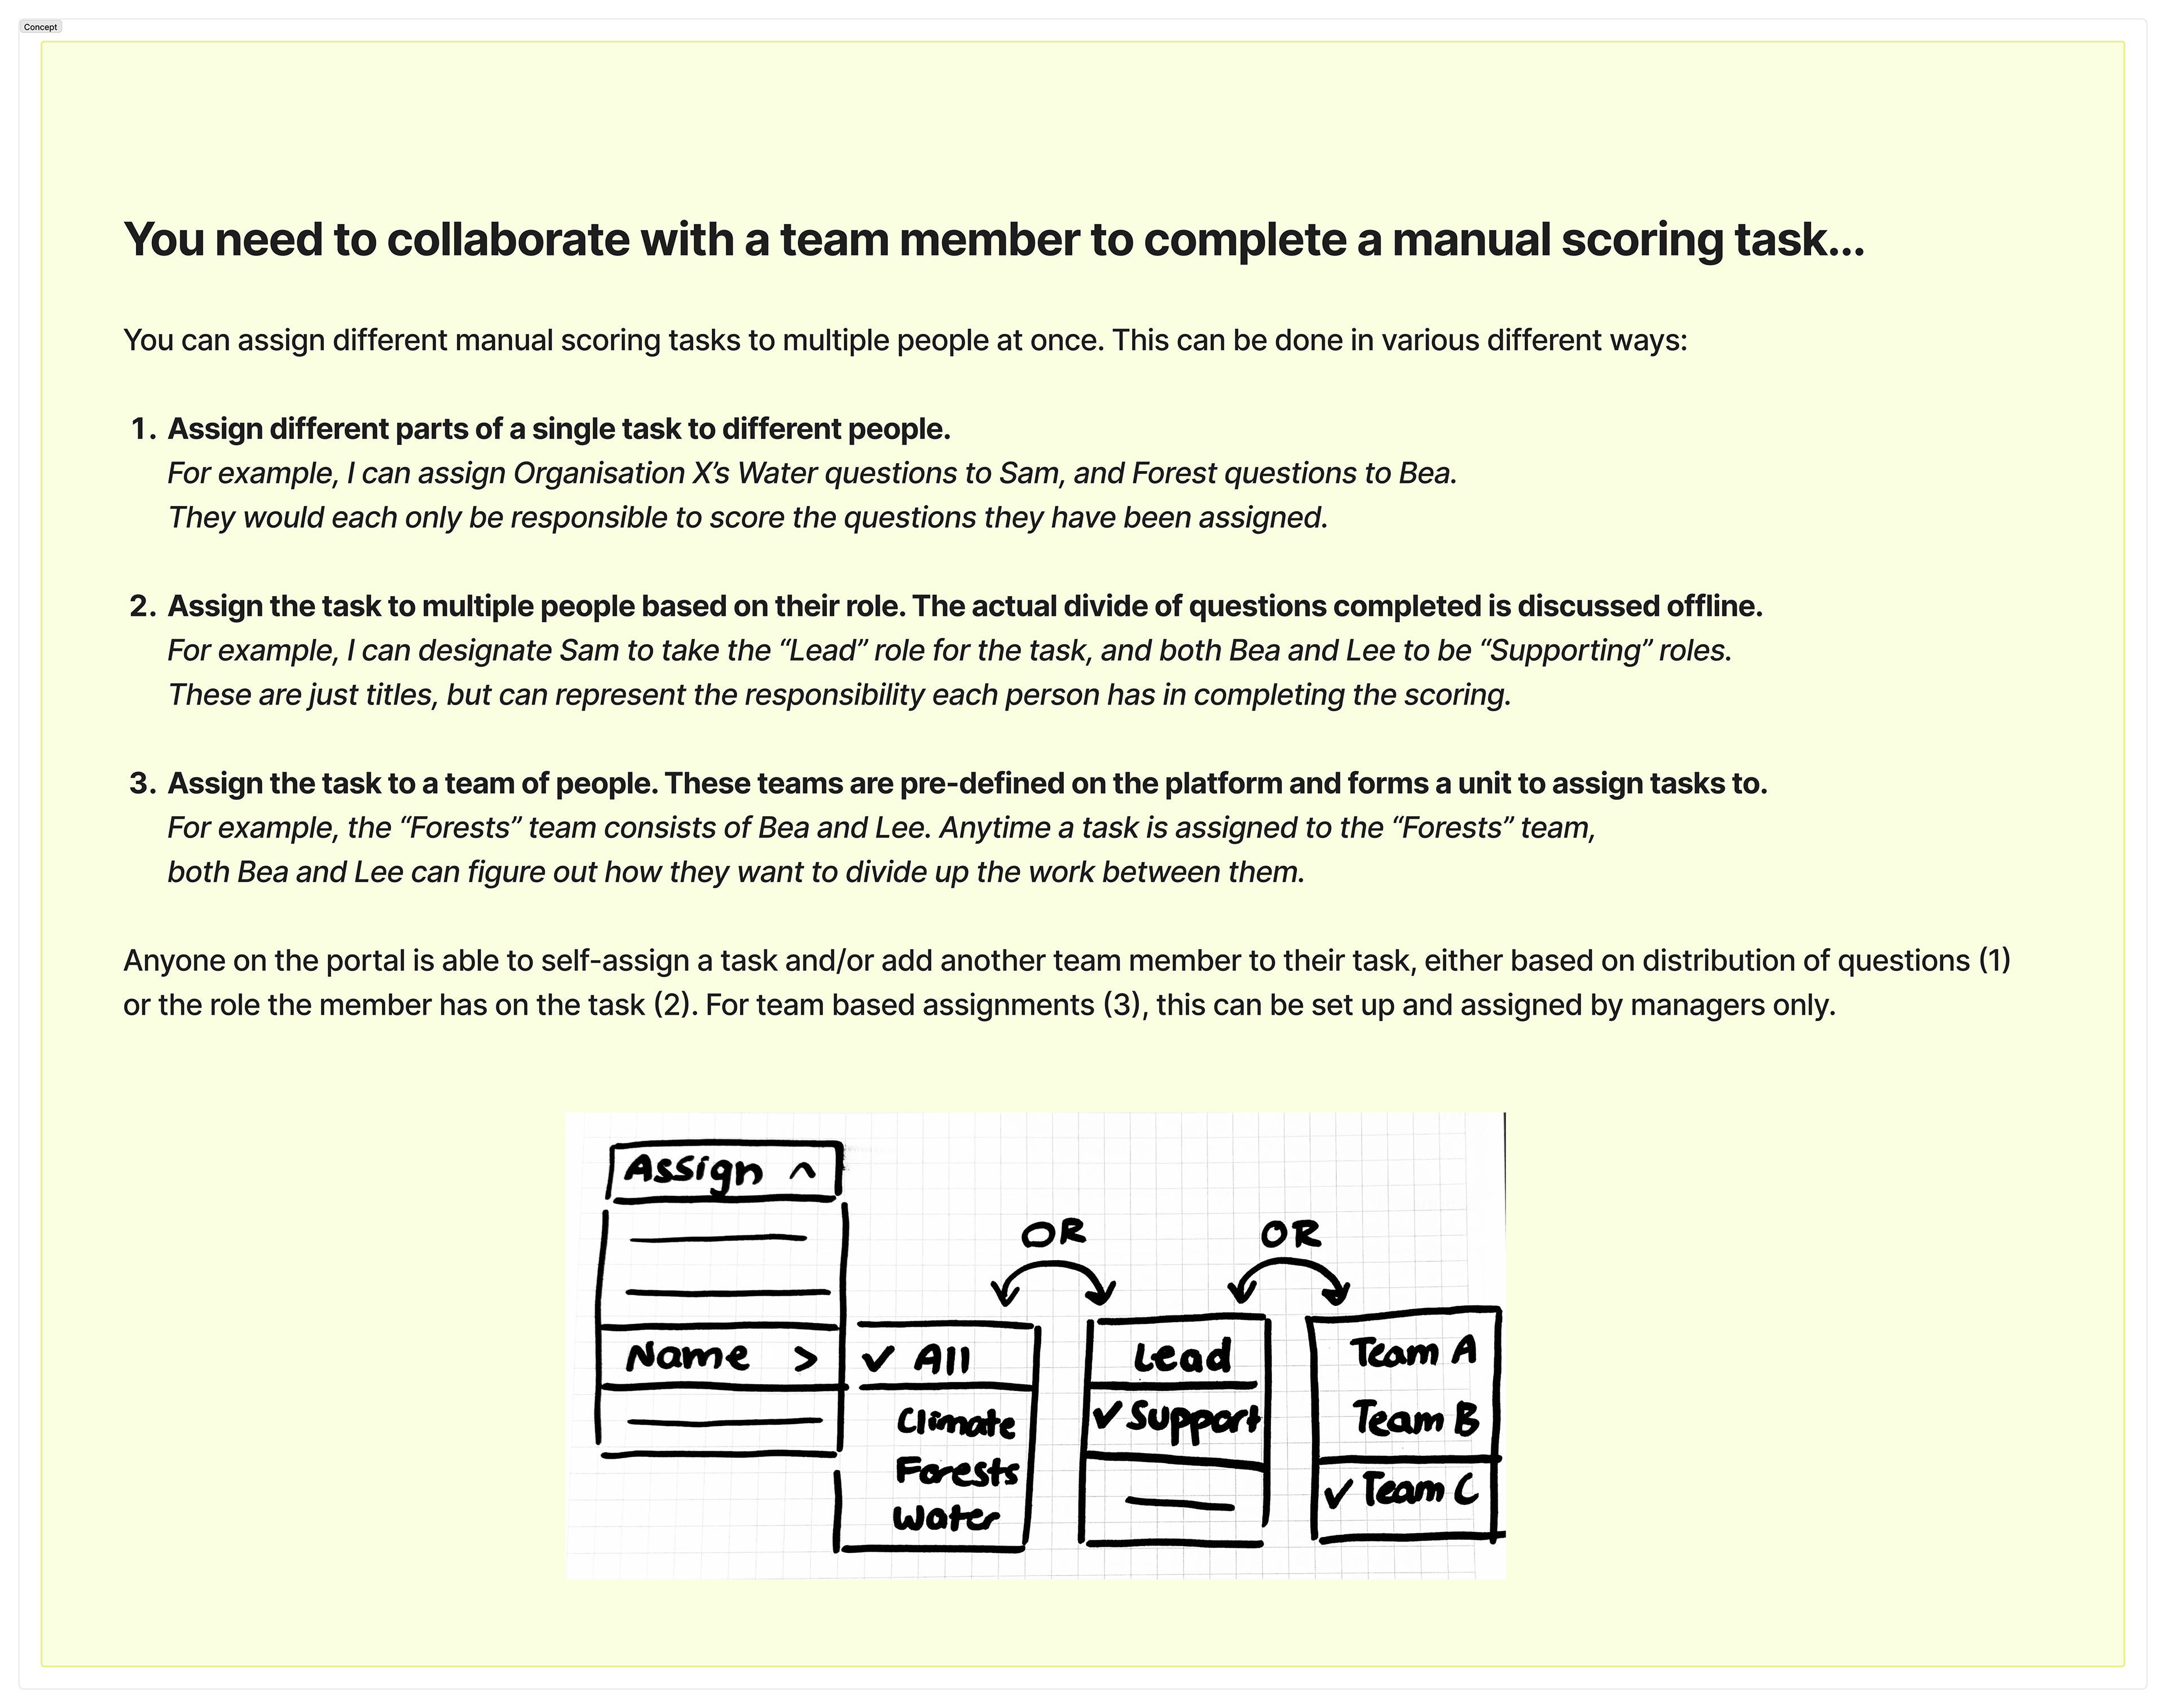
Concept 2
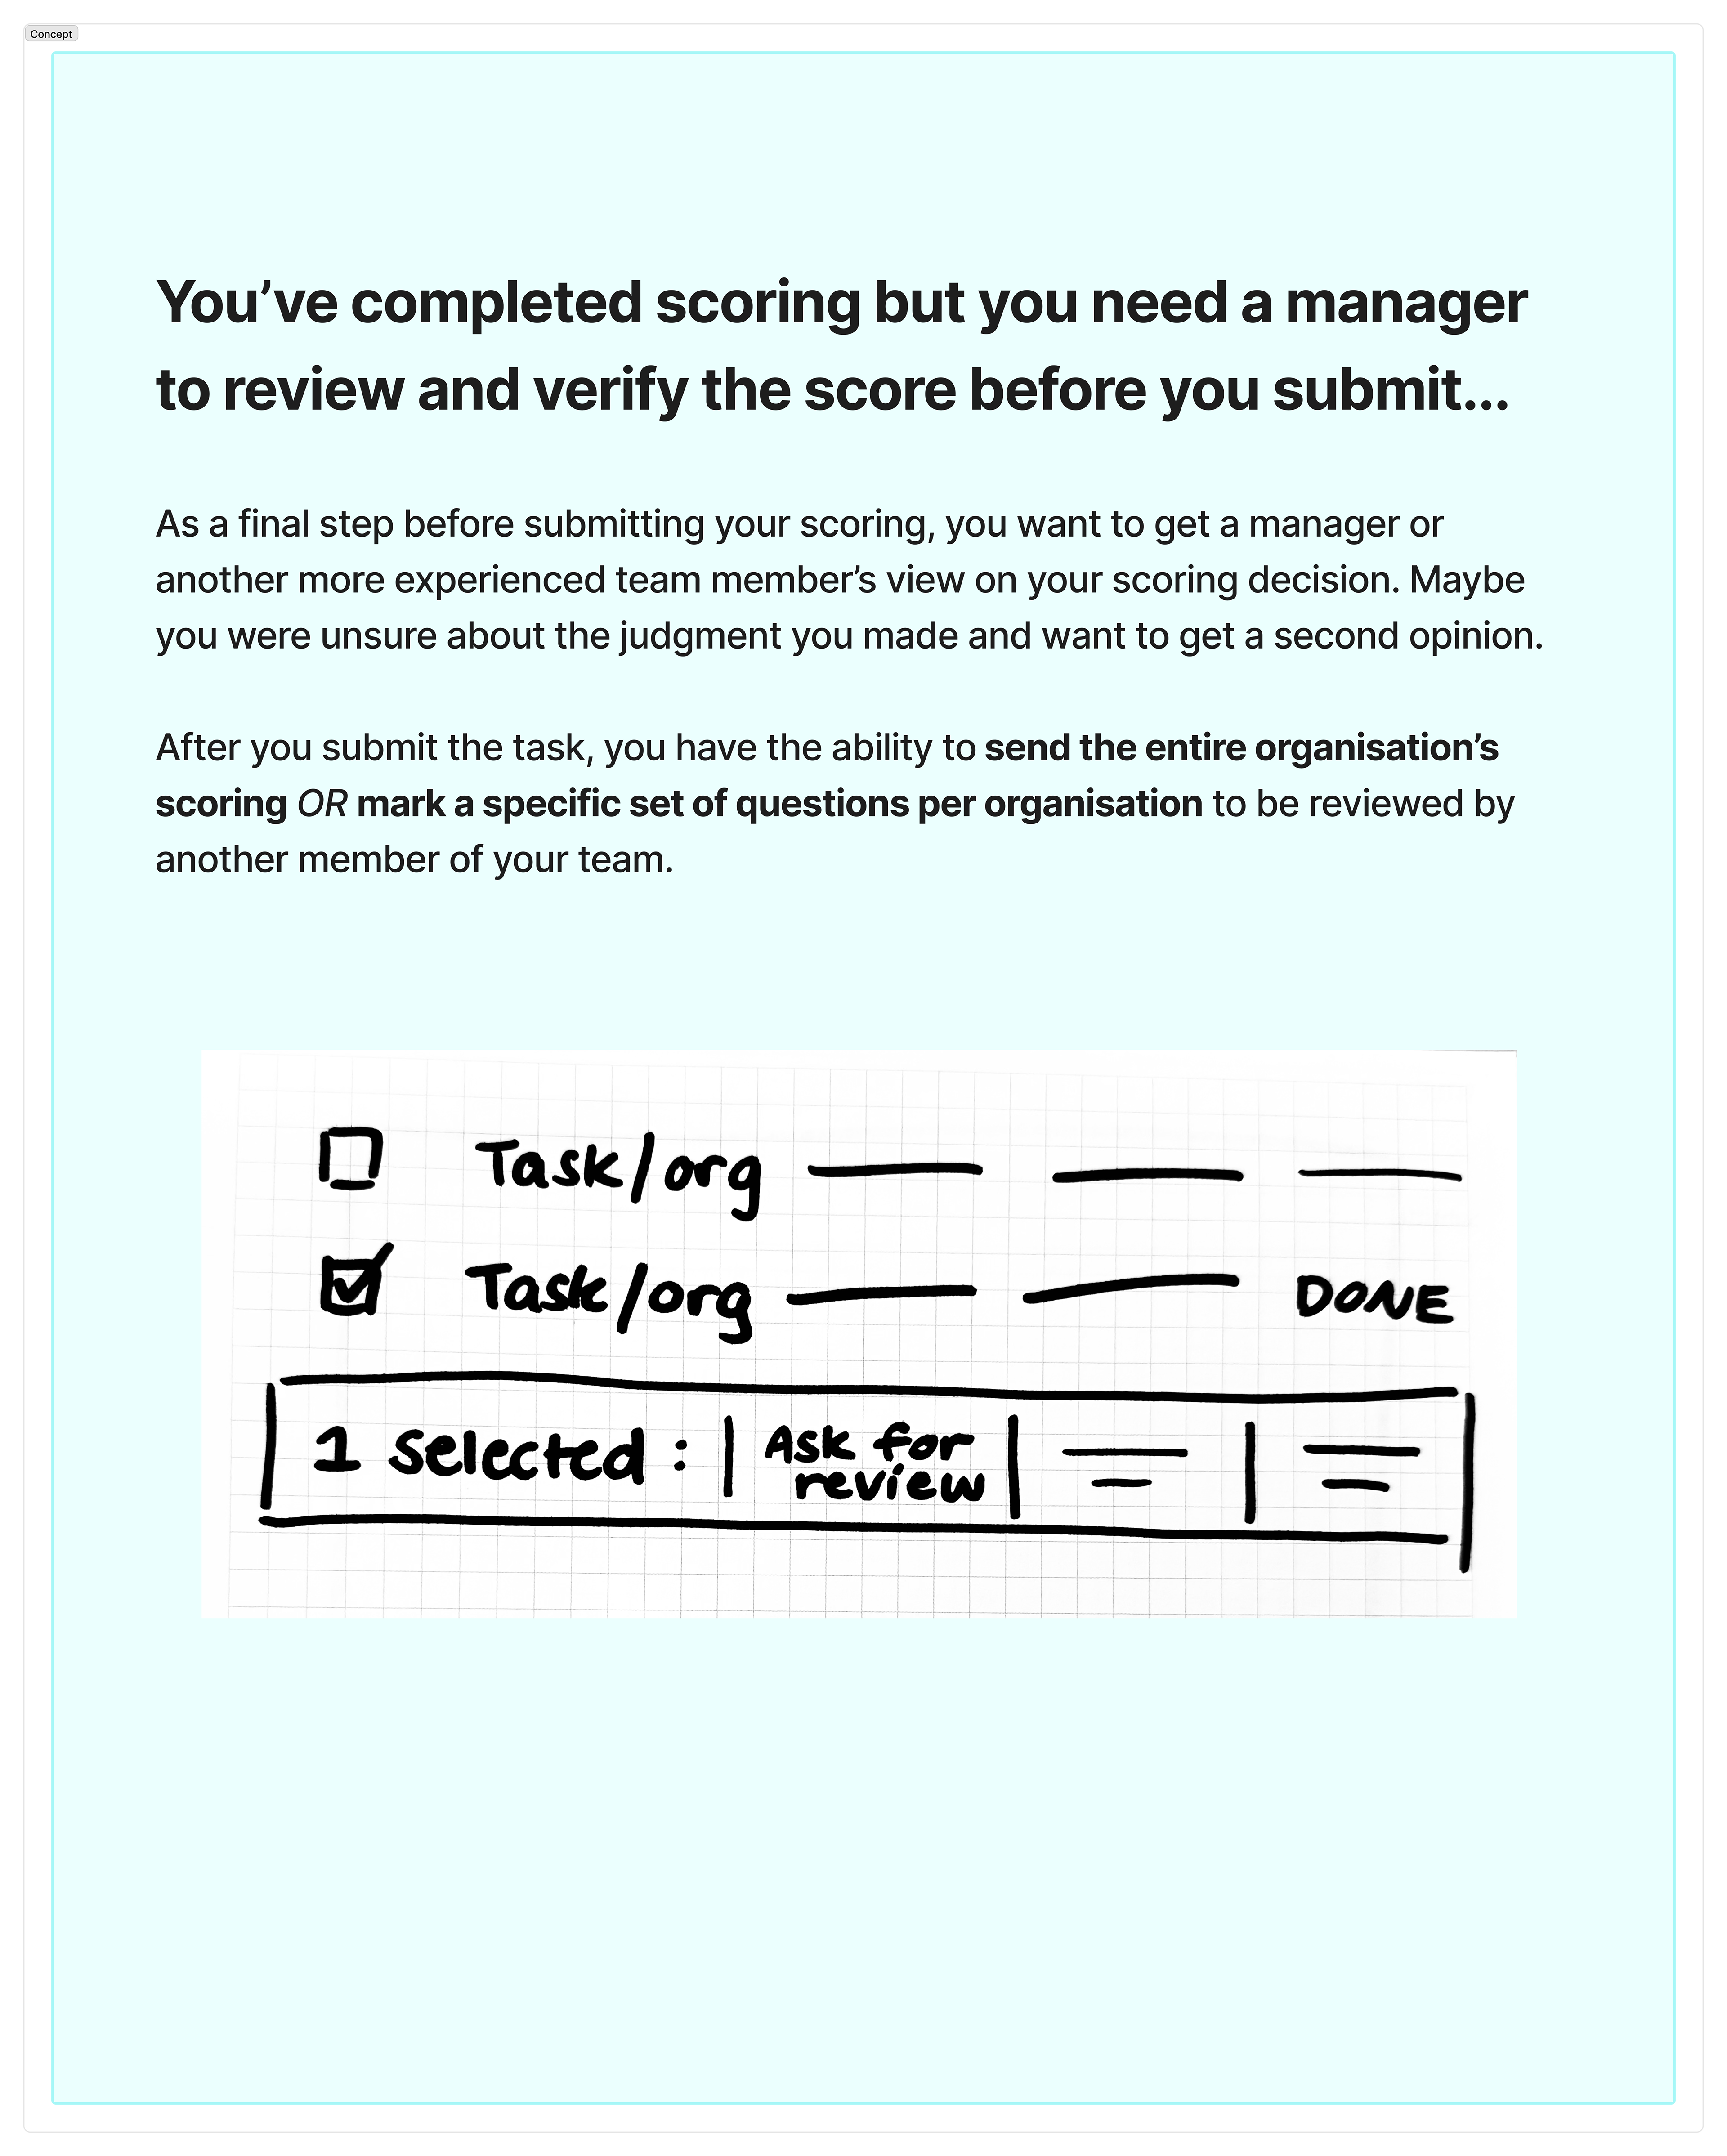
Concept 3
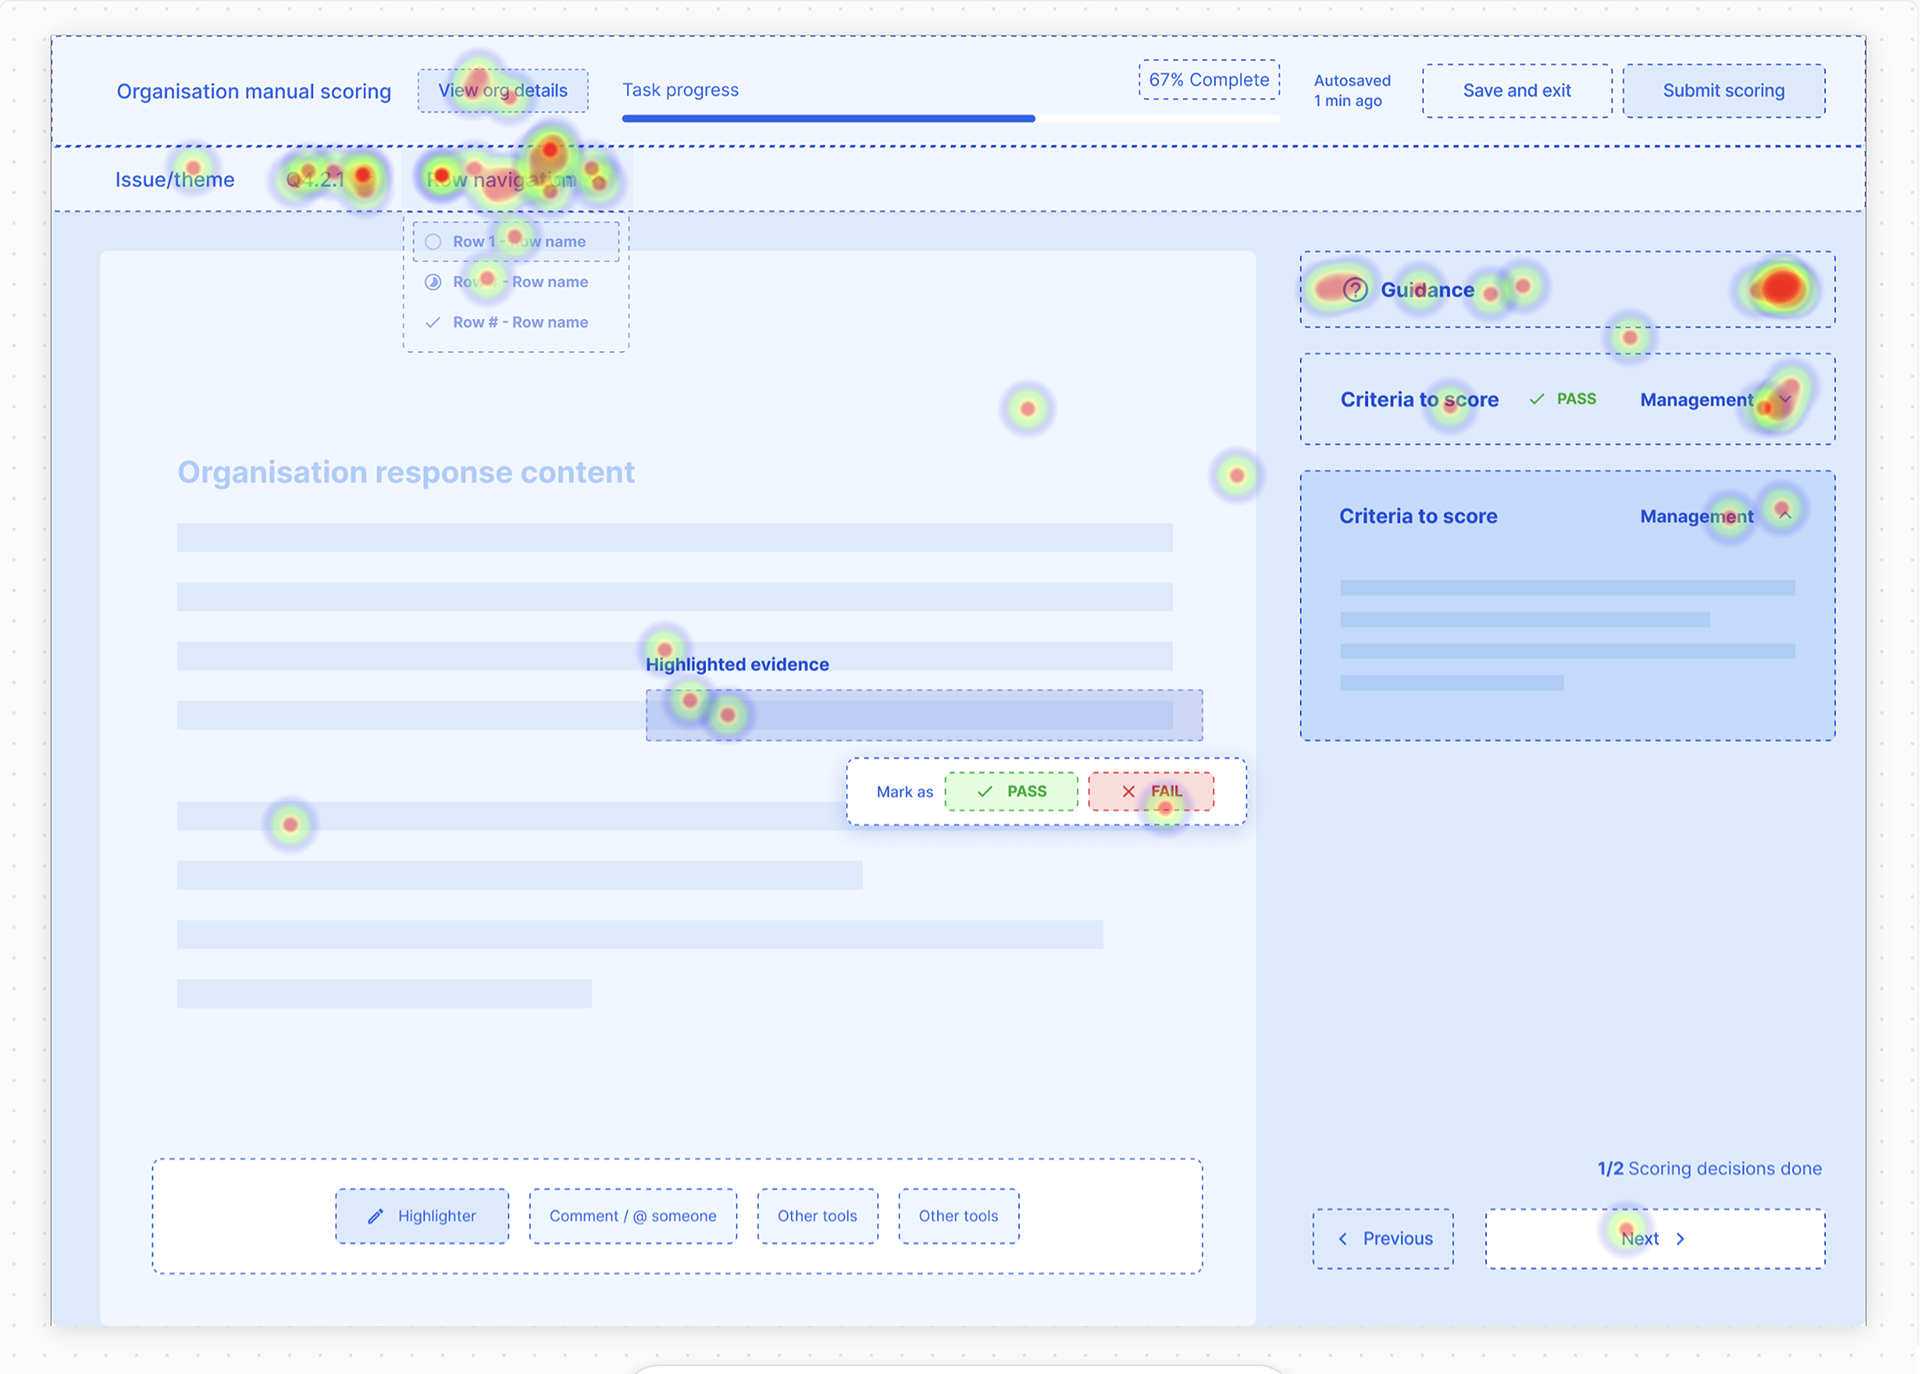
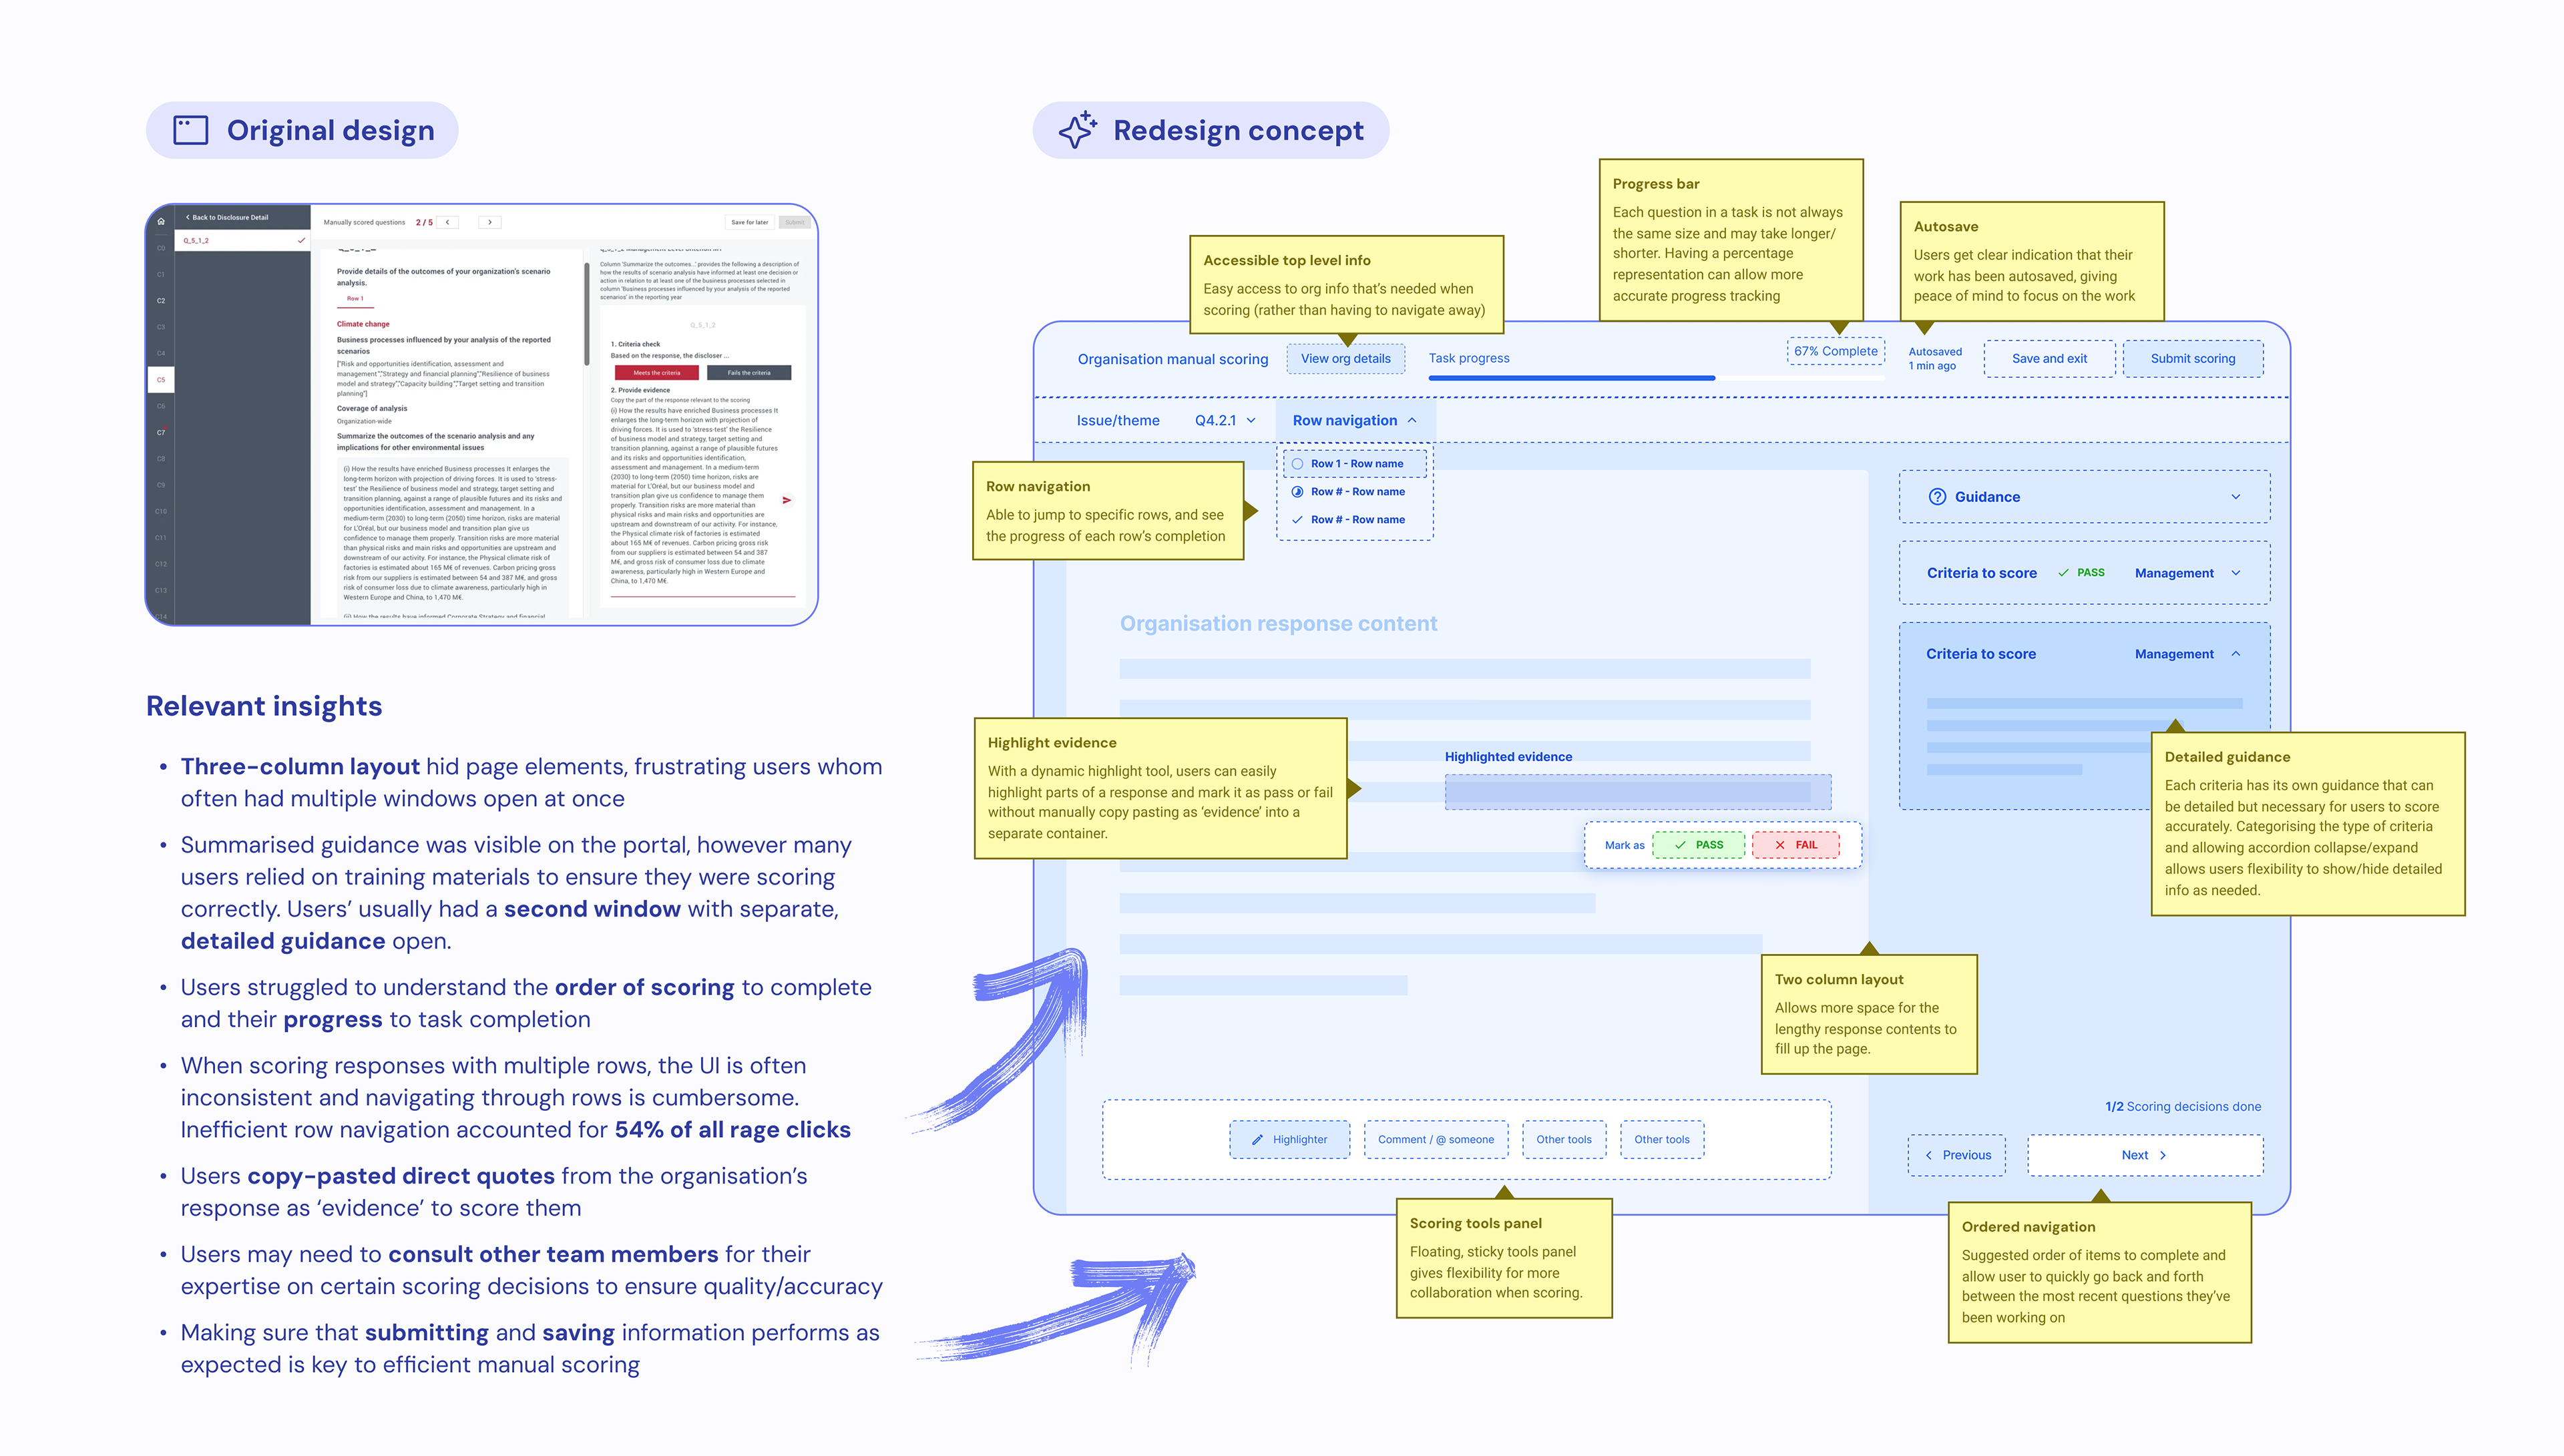
Concept 4 - Manual scoring UI redesign
Next steps
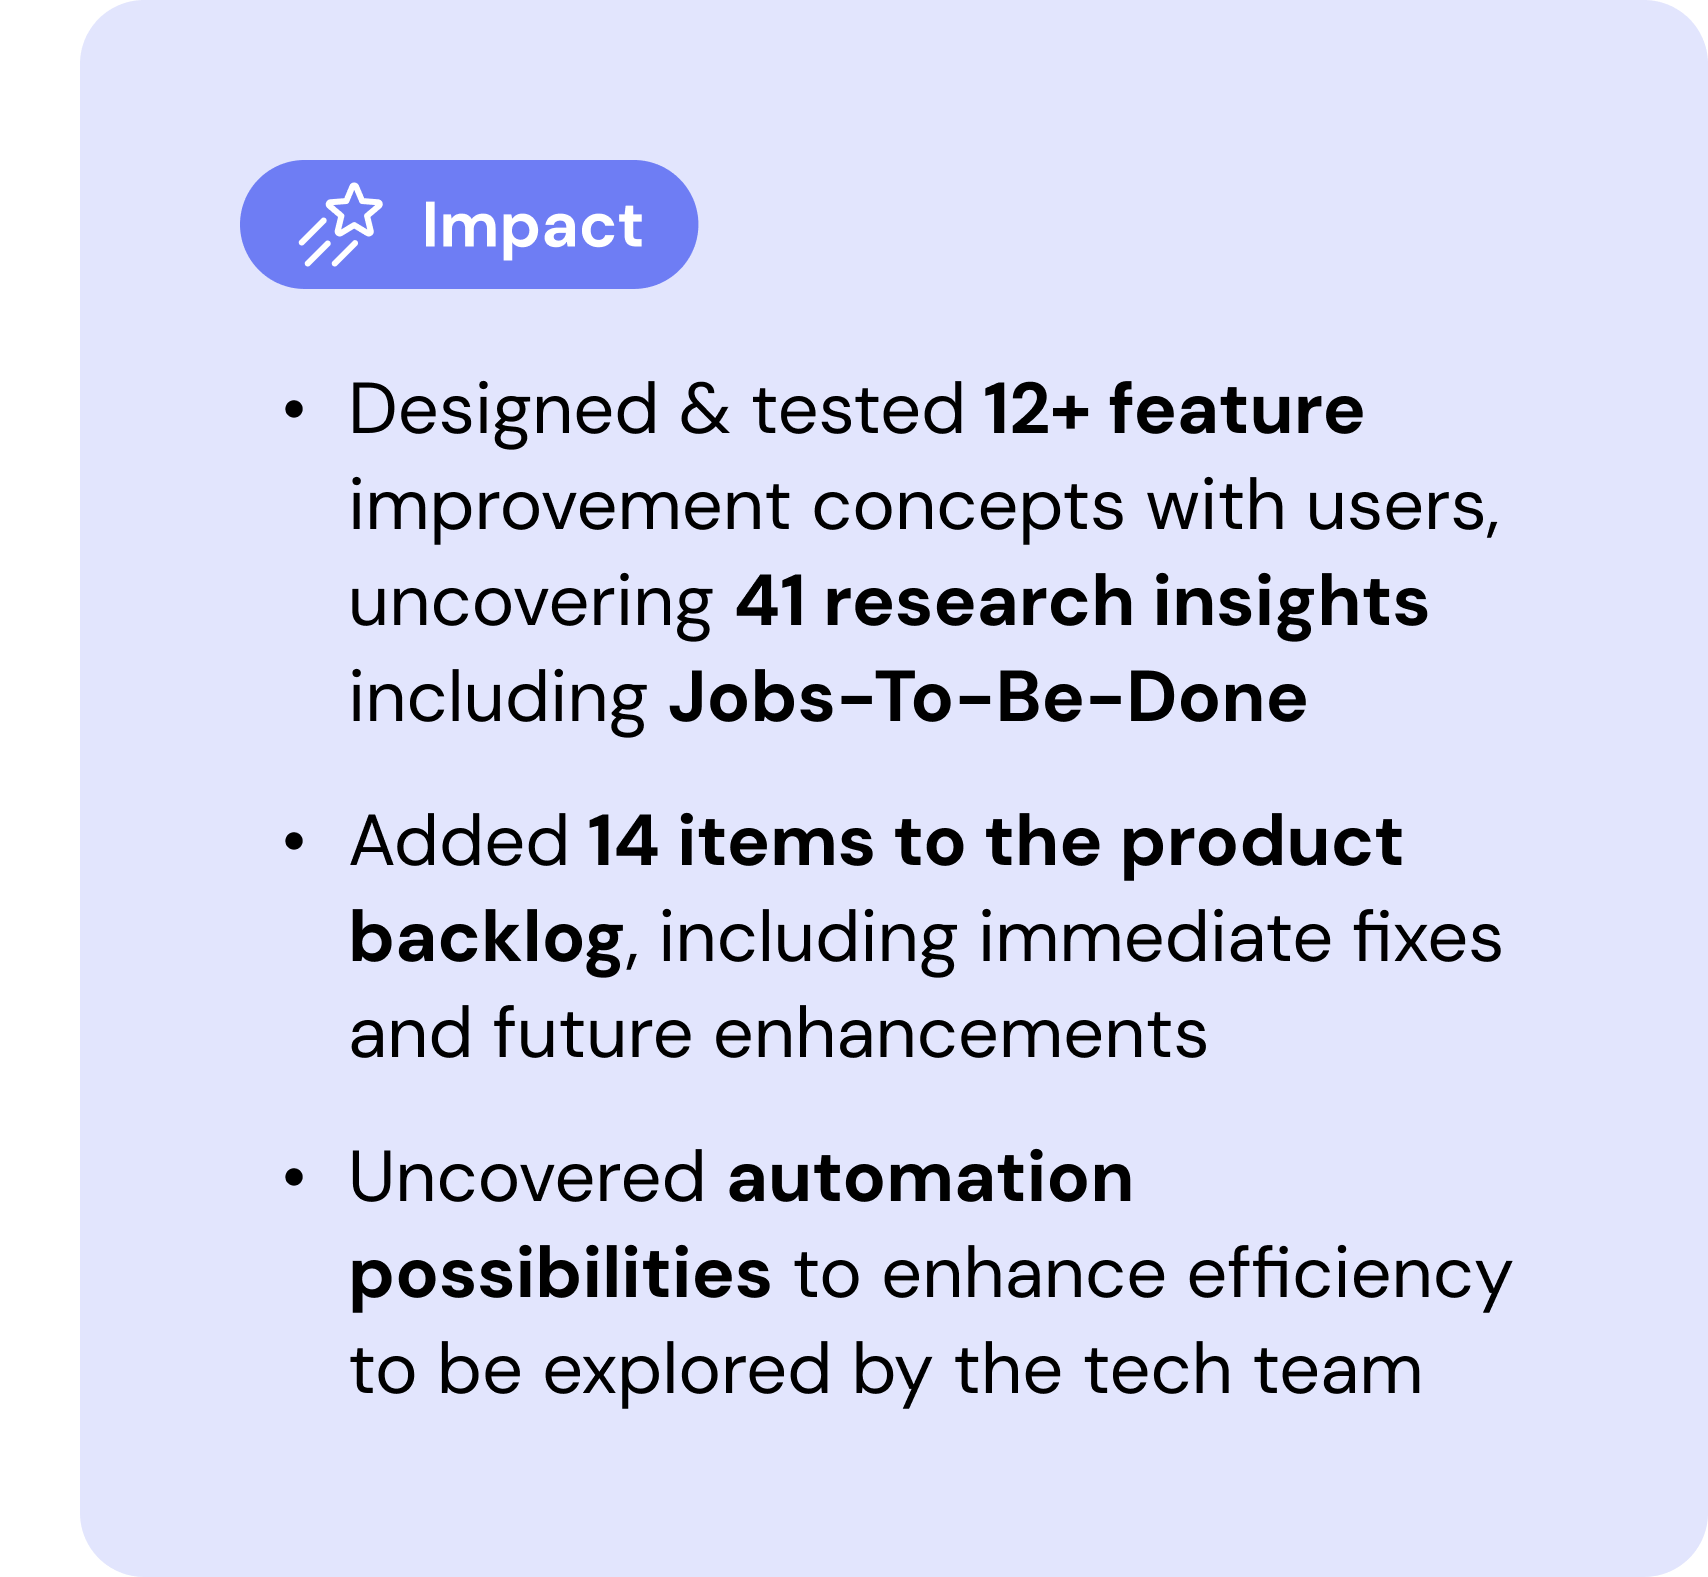
Based on the final evaluation, we added 14 items into our product backlog, then assessed their priority together with our Product Owner and Tech Lead. The latter also provided a general rough t-shirt size estimate where appropriate.
I suggested further tech investigations into:
• Performance issues - I identified during data analysis that the top 5 pages frequented by
manual scorers are on average 23% slower than recommended
manual scorers are on average 23% slower than recommended
• Automation advancements - User research led to ideas around automating translations for
scoring attachments in different languages, and a way to bulk score organisations with
straightforward scoring criteria as to reduce manual workload
scoring attachments in different languages, and a way to bulk score organisations with
straightforward scoring criteria as to reduce manual workload
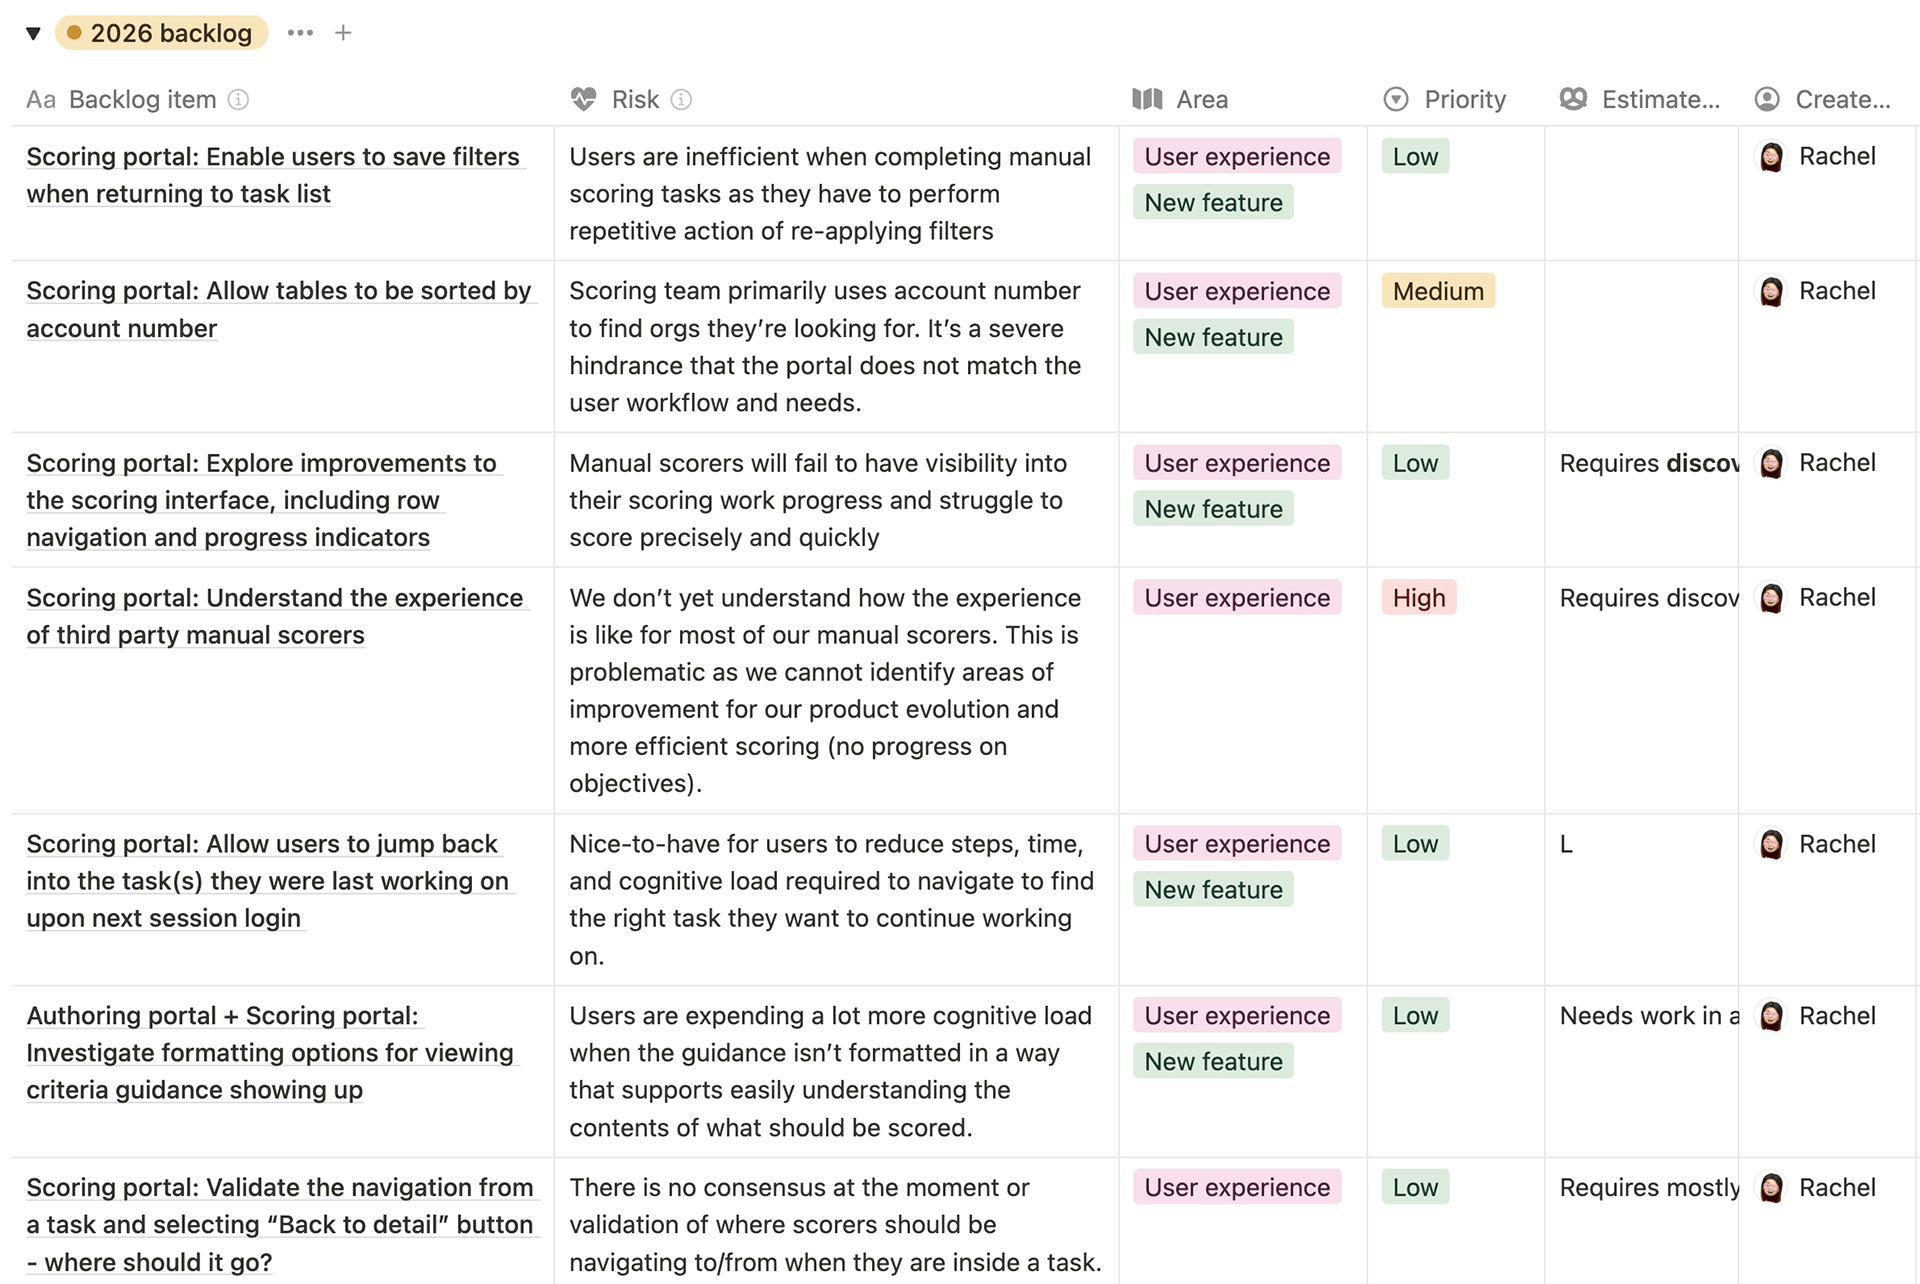
Example backlog items, tracking priority, risks, and estimations
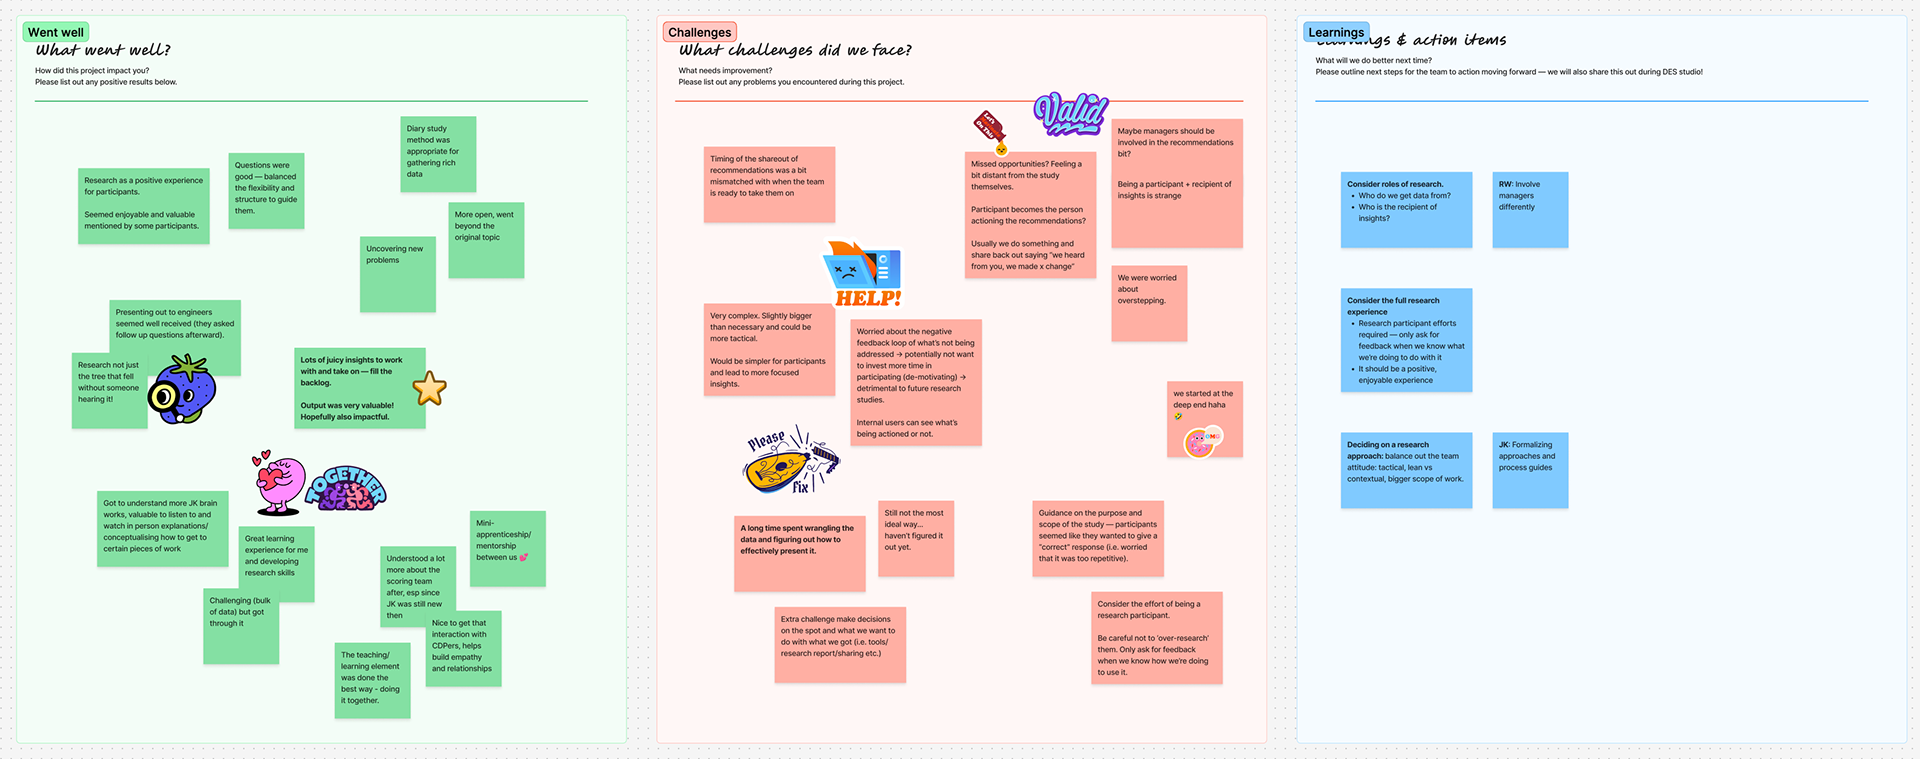
Learnings
In our team, we have a culture of continuous improvement and love to give and receive feedback. After every project we’ll conduct a retro with the project team and celebrate our successes while reflecting on our improvements.
Bonus - some kind words from my squad’s Lead Engineer: